
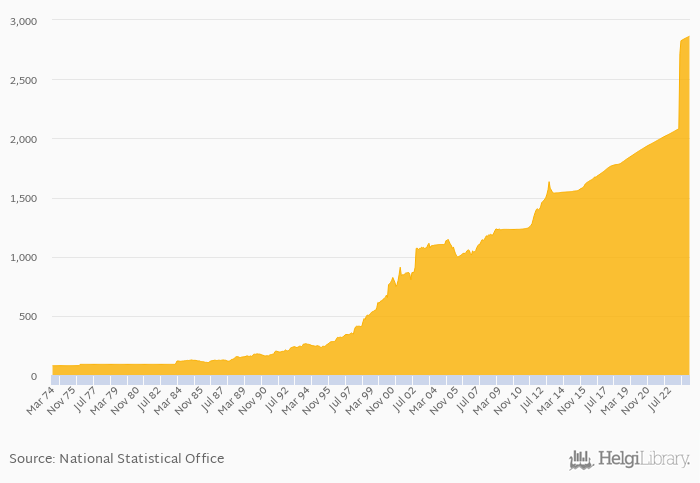
Average FX rate to USD rose 38.2% yoy to 2,863 per USD in Burundi in February 2024, according to the National Statistical Office. This is 0.158% more than in the previous month.
Historically, Average FX rate to USD in Burundi reached an all time high of 2,863 per USD in February 2024 and an all time low of 50.0 per USD in January 1965.
Burundi has been ranked 11th within the group of 138 countries we follow in terms of Average FX rate to USD, 4 places above the position seen 10 years ago.
| FX Rate to USD (Average) | Unit | Jul 2022 | Aug 2022 | Sep 2022 | Oct 2022 | Nov 2022 | Dec 2022 | Jan 2023 | Feb 2023 | Mar 2023 | Apr 2023 | May 2023 | Jun 2023 | Jul 2023 | Aug 2023 | Sep 2023 | Oct 2023 | Nov 2023 | Dec 2023 | Jan 2024 | Feb 2024 | Mar 2024 |
| Angola | per USD | 825 | 826 | 827 | 829 | 829 | ... | |||||||||||||||
| Burundi | per USD | 2,840 | 2,845 | 2,850 | 2,854 | 2,859 | ... | |||||||||||||||
| Central African Republic | per USD | 614 | 621 | 607 | 602 | 602 | ||||||||||||||||
| Congo | per USD | 614 | 621 | 607 | 602 | 602 | ||||||||||||||||
| Dem. Republic of the Congo | per USD | ... | ... | ... | ... | ... | ... | ... | ... | ... | ... | ... | ... | ... | ... | ... | ... | ... | ||||
| Kenya | per USD | 147 | 149 | 153 | 156 | 160 | ... | |||||||||||||||
| Mozambique | per USD | 63.9 | 63.9 | 63.9 | 63.9 | 63.9 | ||||||||||||||||
| Rwanda | per USD | 1,202 | 1,224 | 1,237 | 1,256 | 1,271 | ||||||||||||||||
| South Sudan | per USD | ... | ... | ... | ... | ... | ... | ... | ... | |||||||||||||
| Tanzania | per USD | ... | ... | ... | ... | ... | ... | ... | ... | ... | ... | ... | ... | ... | ... | ... | ... | ... | ... | ... | ||
| Uganda | per USD | 3,738 | 3,756 | 3,782 | 3,781 | 3,805 | ||||||||||||||||
| Zambia | per USD | 20.8 | 21.6 | 23.0 | 24.8 | ... | ... | ... |
 Helgi Library


