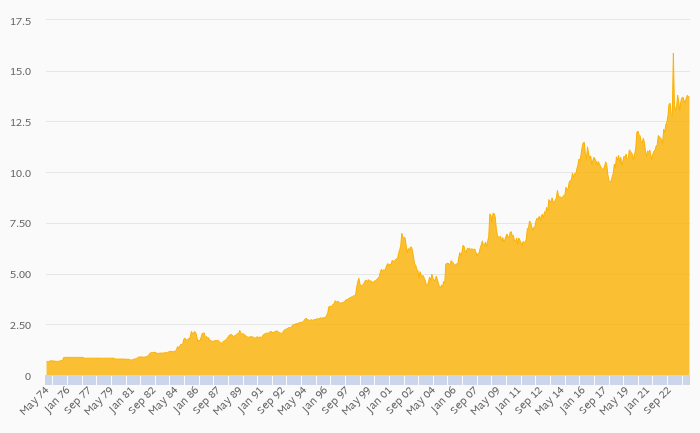
FX rate to USD at the end of period rose 0.126% yoy to 1.36 per USD in Canada in March 2024, according to the National Statistical Office. This is 0.147% less than in the previous month.
Historically, FX rate to USD at the end of period in Canada reached an all time high of 1.60 per USD in February 2002 and an all time low of 0.945 per USD in October 2007. When compared to Canada's main peers, FX rate to USD at the end of period in Australia amounted to 1.53 per USD, 16.7 per USD in Mexico, 0.793 per USD in United Kingdom and 1.00 per USD in USA in March 2024.
Canada has been ranked 97th within the group of 133 countries we follow in terms of FX rate to USD at the end of period, 37 places above the position seen 10 years ago.
| FX Rate to USD (End of Period) | Unit | Aug 2022 | Sep 2022 | Oct 2022 | Nov 2022 | Dec 2022 | Jan 2023 | Feb 2023 | Mar 2023 | Apr 2023 | May 2023 | Jun 2023 | Jul 2023 | Aug 2023 | Sep 2023 | Oct 2023 | Nov 2023 | Dec 2023 | Jan 2024 | Feb 2024 | Mar 2024 | Apr 2024 |
| Australia | per USD | 1.58 | 1.50 | 1.46 | 1.52 | 1.53 | ... | |||||||||||||||
| Belgium | per USD | 0.942 | 0.915 | 0.905 | 0.923 | 0.924 | ||||||||||||||||
| Belize | per USD | 2.00 | 2.00 | 2.00 | 2.00 | 2.00 | ||||||||||||||||
| Canada | per USD | 1.39 | 1.36 | 1.33 | 1.34 | 1.36 | ... | |||||||||||||||
| China | per USD | 7.32 | 7.13 | 7.14 | 7.18 | 7.19 | ... | |||||||||||||||
| France | per USD | 0.942 | 0.915 | 0.905 | 0.923 | 0.924 | ||||||||||||||||
| Germany | per USD | 0.942 | 0.915 | 0.905 | 0.923 | 0.924 | ||||||||||||||||
| Guatemala | per USD | 7.83 | 7.82 | 7.83 | 7.81 | 7.82 | ... | |||||||||||||||
| Honduras | per USD | 24.7 | 24.7 | 24.7 | 24.6 | 24.7 | ||||||||||||||||
| Indonesia | per USD | 15,916 | 15,384 | 15,416 | 15,796 | 15,673 | ||||||||||||||||
| Ireland | per USD | 0.942 | 0.915 | 0.905 | 0.923 | 0.924 | ||||||||||||||||
| Japan | per USD | 149 | 147 | 142 | 148 | 151 | ||||||||||||||||
| Malaysia | per USD | 4.77 | 4.65 | 4.59 | 4.73 | 4.76 | ... | |||||||||||||||
| Mexico | per USD | 18.1 | 17.1 | 16.9 | 17.2 | 17.1 | ... | |||||||||||||||
| New Zealand | per USD | 1.71 | 1.62 | 1.58 | 1.63 | 1.64 | ||||||||||||||||
| Papua New Guinea | per USD | ... | ... | ... | ... | ... | ... | ... | ... | ... | ... | ... | ||||||||||
| USA | per USD | 1.00 | 1.00 | 1.00 | 1.00 | 1.00 | ||||||||||||||||
| United Kingdom | per USD | 0.821 | 0.791 | 0.785 | 0.788 | 0.790 |
 Helgi Library