
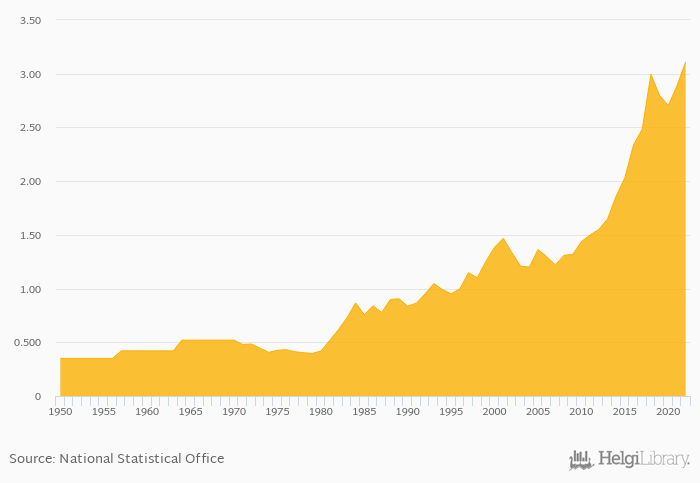
FX rate to USD at the end of period rose 7.75% to 3.11 per USD in Tunisia in 2022, according to the National Statistical Office.
Historically, FX rate to USD at the end of period in Tunisia reached an all time high of 3.11 per USD in 2022 and an all time low of 0.350 per USD in 1950. When compared to Tunisia's main peers, FX rate to USD at the end of period in Algeria amounted to 137 per USD, 0.852 per USD in Italy, 4.83 per USD in Libya and 0.852 per USD in Malta in 2022.
Tunisia has been ranked 112th within the group of 161 countries we follow in terms of FX rate to USD at the end of period, 18 places above the position seen 10 years ago.
| FX Rate to USD (End of Period) | Unit | 2003 | 2004 | 2005 | 2006 | 2007 | 2008 | 2009 | 2010 | 2011 | 2012 | 2013 | 2014 | 2015 | 2016 | 2017 | 2018 | 2019 | 2020 | 2021 | 2022 | 2023 |
| Algeria | per USD | 115 | 118 | 119 | 132 | 139 | ||||||||||||||||
| Austria | per USD | 0.834 | 0.873 | 0.892 | 0.815 | 0.883 | ||||||||||||||||
| Chad | per USD | 547 | 573 | 584 | 535 | 579 | ||||||||||||||||
| Egypt | per USD | 17.7 | 17.9 | 16.0 | 15.7 | 15.7 | ||||||||||||||||
| France | per USD | 0.834 | 0.873 | 0.892 | 0.815 | 0.883 | ||||||||||||||||
| Greece | per USD | 0.834 | 0.873 | 0.892 | 0.815 | 0.883 | ||||||||||||||||
| Italy | per USD | 0.834 | 0.873 | 0.892 | 0.815 | 0.883 | ||||||||||||||||
| Libya | per USD | 1.36 | 1.39 | 1.40 | 1.34 | 4.60 | ||||||||||||||||
| Malta | per USD | 0.834 | 0.873 | 0.892 | 0.815 | 0.883 | ||||||||||||||||
| Morocco | per USD | 9.33 | 9.57 | 9.59 | 8.90 | 9.28 | ||||||||||||||||
| Slovenia | per USD | 0.834 | 0.873 | 0.892 | 0.815 | 0.883 | ||||||||||||||||
| Spain | per USD | 0.834 | 0.873 | 0.892 | 0.815 | 0.883 | ||||||||||||||||
| Switzerland | per USD | 0.975 | 0.985 | 0.968 | 0.881 | 0.913 | ||||||||||||||||
| Tunisia | per USD | 2.48 | 2.99 | 2.80 | 2.70 | 2.89 | ||||||||||||||||
| Turkey | per USD | 3.78 | 5.27 | 5.95 | 7.35 | 13.0 |
 Helgi Library


