
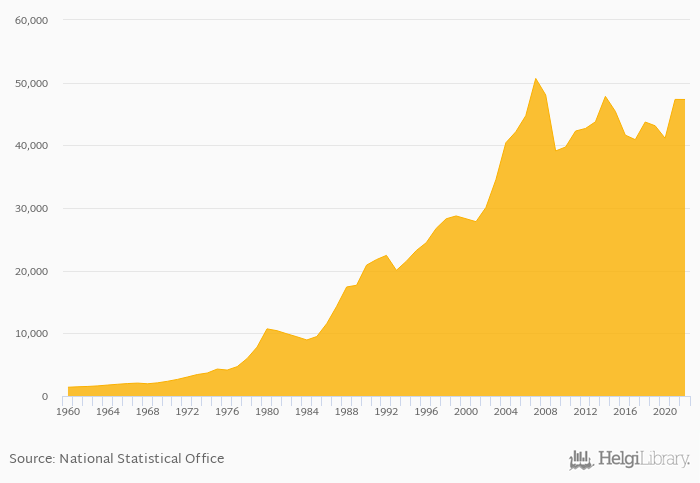
GDP per capita in USD terms fell 0.024% to USD 47,318 in the United Kingdom in 2022, according to the National Statistical Office.
Historically, GDP per capita in USD terms in the United Kingdom reached an all time high of USD 50,676 in 2007 and an all time low of USD 1,398 in 1960. When compared to United Kingdom's main peers, GDP per capita in USD terms in Belgium amounted to USD 50,598 , USD 42,330 in France, USD 48,398 in Germany and USD 102,217 in Ireland in 2022.
United Kingdom has been ranked 21st within the group of 172 countries we follow in terms of GDP per capita in USD terms, 5 places above the position seen 10 years ago.
| GDP Per Capita (Current USD) | Unit | 2007 | 2008 | 2009 | 2010 | 2011 | 2012 | 2013 | 2014 | 2015 | 2016 | 2017 | 2018 | 2019 | 2020 | 2021 | 2022 | 2023 | 2024 | 2025 | 2026 | 2027 |
| Austria | USD | 53,332 | 52,062 | 52,316 | 54,409 | 56,625 | ||||||||||||||||
| Belgium | USD | 51,849 | 50,598 | 50,906 | 52,786 | 54,628 | ||||||||||||||||
| Canada | USD | 52,015 | 56,794 | 59,179 | 60,745 | 62,704 | ||||||||||||||||
| France | USD | 45,188 | 42,330 | 42,646 | 44,431 | 46,193 | ||||||||||||||||
| Germany | USD | 51,238 | 48,398 | 49,430 | 52,018 | 54,531 | ||||||||||||||||
| Iceland | USD | 69,422 | 73,981 | 77,961 | 83,432 | 88,661 | ||||||||||||||||
| Ireland | USD | 100,129 | 102,217 | 106,997 | 114,728 | 120,693 | ||||||||||||||||
| Italy | USD | 35,473 | 33,740 | 33,662 | 34,836 | 36,093 | ||||||||||||||||
| Luxembourg | USD | 136,701 | 127,673 | 128,819 | 134,796 | 140,037 | ||||||||||||||||
| Netherlands | USD | 57,997 | 56,298 | 57,629 | 60,621 | 63,173 | ||||||||||||||||
| Poland | USD | 17,946 | 19,023 | 20,045 | 21,601 | 23,343 | ||||||||||||||||
| Spain | USD | 30,090 | 29,198 | 29,729 | 31,447 | 33,081 | ||||||||||||||||
| United Kingdom | USD | 47,329 | 47,318 | 51,286 | 55,190 | 58,120 |
 Helgi Library


