
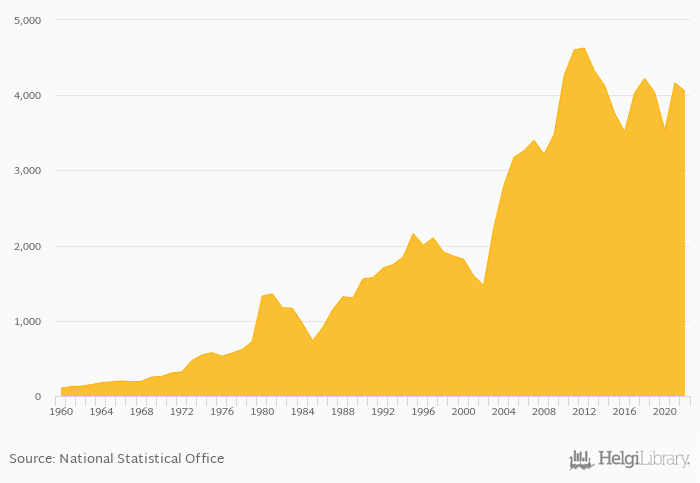
GDP per capita in USD terms fell 2.61% to USD 4,056 in Swaziland in 2022, according to the National Statistical Office.
Historically, GDP per capita in USD terms in Swaziland reached an all time high of USD 4,628 in 2012 and an all time low of USD 104 in 1960. When compared to Swaziland's main peers, GDP per capita in USD terms in Botswana amounted to USD 7,348 , USD 1,187 in Lesotho, USD 542 in Mozambique and USD 6,739 in South Africa in 2022.
Swaziland has been ranked 107th within the group of 172 countries we follow in terms of GDP per capita in USD terms, 5 places below the position seen 10 years ago.
| GDP Per Capita (Current USD) | Unit | 2007 | 2008 | 2009 | 2010 | 2011 | 2012 | 2013 | 2014 | 2015 | 2016 | 2017 | 2018 | 2019 | 2020 | 2021 | 2022 | 2023 | 2024 | 2025 | 2026 | 2027 |
| Botswana | USD | 7,337 | 7,348 | 7,463 | 7,865 | 8,242 | ||||||||||||||||
| Lesotho | USD | 1,181 | 1,187 | 1,208 | 1,248 | 1,294 | ||||||||||||||||
| Malawi | USD | 559 | 523 | 483 | 482 | 485 | ||||||||||||||||
| Mozambique | USD | 492 | 542 | 579 | 624 | 648 | ||||||||||||||||
| Namibia | USD | 4,826 | 4,809 | 5,052 | 5,231 | 5,389 | ||||||||||||||||
| South Africa | USD | 6,965 | 6,739 | 6,813 | 6,968 | 7,126 | ||||||||||||||||
| Swaziland | USD | 4,165 | 4,056 | 4,189 | 4,382 | 4,545 | ||||||||||||||||
| Tanzania | USD | 1,177 | 1,245 | 1,341 | 1,431 | 1,512 | ||||||||||||||||
| Zambia | USD | 1,095 | 1,348 | 1,395 | 1,457 | 1,522 | ||||||||||||||||
| Zimbabwe | USD | 2,122 | 2,420 | 2,308 | 2,349 | 2,310 |
 Helgi Library


