
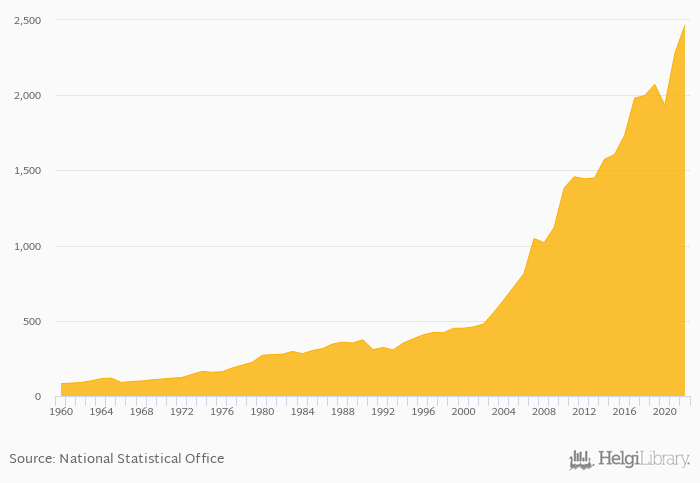
GDP per capita in USD terms rose 8.18% to USD 2,466 in India in 2022, according to the National Statistical Office.
Historically, GDP per capita in USD terms in India reached an all time high of USD 2,466 in 2022 and an all time low of USD 82.2 in 1960. When compared to India's main peers, GDP per capita in USD terms in Bangladesh amounted to USD 2,734 , USD 12,970 in China, USD 1,658 in Pakistan and USD 3,293 in Sri Lanka in 2022.
India has been ranked 122nd within the group of 172 countries we follow in terms of GDP per capita in USD terms, 14 places above the position seen 10 years ago.
| GDP Per Capita (Current USD) | Unit | 2007 | 2008 | 2009 | 2010 | 2011 | 2012 | 2013 | 2014 | 2015 | 2016 | 2017 | 2018 | 2019 | 2020 | 2021 | 2022 | 2023 | 2024 | 2025 | 2026 | 2027 |
| Afghanistan | USD | 506 | 523 | 541 | 556 | 572 | ... | ... | ||||||||||||||
| Bangladesh | USD | 2,498 | 2,734 | 2,847 | 3,151 | 3,475 | ||||||||||||||||
| Bhutan | USD | 3,245 | 3,562 | 3,856 | 4,187 | 4,543 | ||||||||||||||||
| China | USD | 12,562 | 12,970 | 13,629 | 14,671 | 15,898 | ||||||||||||||||
| India | USD | 2,280 | 2,466 | 2,691 | 2,911 | 3,147 | ||||||||||||||||
| Iran | USD | 18,739 | 23,034 | 23,619 | 24,433 | 25,266 | ||||||||||||||||
| Japan | USD | 39,301 | 34,358 | 35,034 | 36,833 | 38,983 | ||||||||||||||||
| Malaysia | USD | 11,408 | 13,108 | 13,943 | 14,826 | 15,718 | ||||||||||||||||
| Maldives | USD | 13,539 | 15,097 | 16,440 | 17,567 | 18,609 | ||||||||||||||||
| Myanmar | USD | 1,217 | 1,105 | 1,173 | 1,232 | 1,294 | ||||||||||||||||
| Pakistan | USD | 1,564 | 1,658 | ... | ... | ... | ... | ... | ||||||||||||||
| Russia | USD | 12,219 | 14,665 | 14,705 | 14,800 | 14,913 | ||||||||||||||||
| Sri Lanka | USD | 4,016 | 3,293 | 4,472 | 4,770 | 5,095 | ... | ... | ||||||||||||||
| USA | USD | 69,227 | 75,180 | 78,422 | 80,779 | 83,463 |
 Helgi Library


