
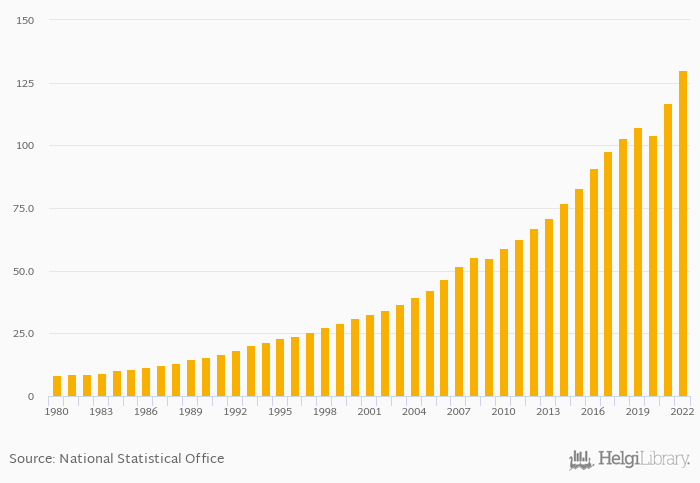
GDP in USD PPP terms rose 11.2% to USD 130 bil in Costa Rica in 2022, according to the National Statistical Office.
Historically, GDP in USD PPP terms in Costa Rica reached an all time high of USD 130 bil in 2022 and an all time low of USD 8.20 bil in 1980. When compared to Costa Rica's main peers, GDP in USD PPP terms in Guatemala amounted to USD 186 bil, USD 69.7 bil in Honduras, USD 47.3 bil in Nicaragua and USD 160 bil in Panama in 2022.
Costa Rica has been ranked 89th within the group of 173 countries we follow in terms of GDP in USD PPP terms, 6 places above the position seen 10 years ago.
| GDP PPP (Current USD) | Unit | 2007 | 2008 | 2009 | 2010 | 2011 | 2012 | 2013 | 2014 | 2015 | 2016 | 2017 | 2018 | 2019 | 2020 | 2021 | 2022 | 2023 | 2024 | 2025 | 2026 | 2027 |
| Belize | USD bil | 3.81 | 4.22 | 4.46 | 4.65 | 4.83 | ||||||||||||||||
| Colombia | USD bil | 837 | 965 | 1,021 | 1,071 | 1,126 | ||||||||||||||||
| Costa Rica | USD bil | 117 | 130 | 138 | 146 | 153 | ||||||||||||||||
| El Salvador | USD bil | 63.0 | 69.3 | 73.0 | 75.7 | 78.5 | ||||||||||||||||
| Guatemala | USD bil | 168 | 186 | 199 | 211 | 222 | ||||||||||||||||
| Honduras | USD bil | 62.9 | 69.7 | 74.7 | 79.1 | 83.5 | ||||||||||||||||
| Mexico | USD bil | 2,669 | 2,920 | 3,059 | 3,179 | 3,307 | ||||||||||||||||
| Nicaragua | USD bil | 42.4 | 47.3 | 50.4 | 53.3 | 56.3 | ||||||||||||||||
| Panama | USD bil | 139 | 160 | 172 | 184 | 196 | ||||||||||||||||
| USA | USD bil | 22,996 | 25,035 | 26,185 | 27,057 | 28,045 |
 Helgi Library


