
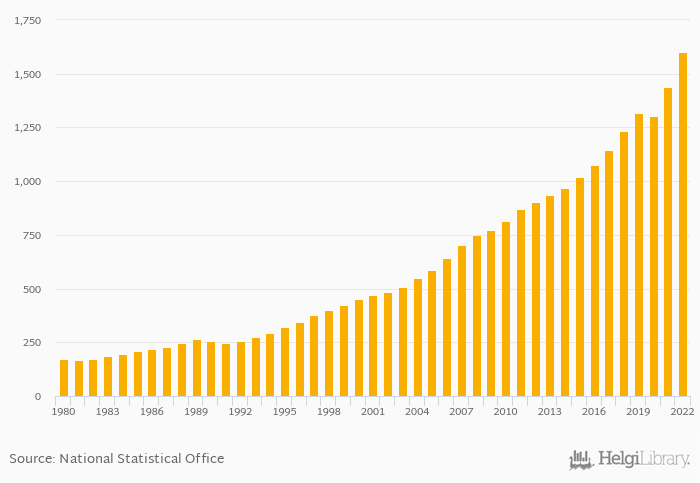
GDP in USD PPP terms rose 11.2% to USD 1,599 bil in Poland in 2022, according to the National Statistical Office.
Historically, GDP in USD PPP terms in Poland reached an all time high of USD 1,599 bil in 2022 and an all time low of USD 169 bil in 1981. When compared to Poland's main peers, GDP in USD PPP terms in Czechia amounted to USD 515 bil, USD 5,317 bil in Germany, USD 4,650 bil in Russia and USD 584 bil in Ukraine in 2022.
Poland has been ranked 23rd within the group of 173 countries we follow in terms of GDP in USD PPP terms.
| GDP PPP (Current USD) | Unit | 2007 | 2008 | 2009 | 2010 | 2011 | 2012 | 2013 | 2014 | 2015 | 2016 | 2017 | 2018 | 2019 | 2020 | 2021 | 2022 | 2023 | 2024 | 2025 | 2026 | 2027 |
| Austria | USD bil | 535 | 599 | 627 | 652 | 676 | ||||||||||||||||
| Belgium | USD bil | 659 | 723 | 752 | 778 | 802 | ||||||||||||||||
| China | USD bil | 27,206 | 30,074 | 32,529 | 34,706 | 36,988 | ||||||||||||||||
| Czechia | USD bil | 472 | 515 | 541 | 574 | 604 | ||||||||||||||||
| France | USD bil | 3,359 | 3,688 | 3,845 | 3,987 | 4,134 | ||||||||||||||||
| Germany | USD bil | 4,888 | 5,317 | 5,490 | 5,690 | 5,921 | ||||||||||||||||
| Hungary | USD bil | 362 | 410 | 432 | 453 | 476 | ||||||||||||||||
| Japan | USD bil | 5,607 | 6,110 | 6,430 | 6,653 | 6,839 | ||||||||||||||||
| Poland | USD bil | 1,438 | 1,599 | 1,664 | 1,752 | 1,845 | ||||||||||||||||
| Romania | USD bil | 652 | 731 | 781 | 827 | 872 | ||||||||||||||||
| Russia | USD bil | 4,494 | 4,650 | 4,706 | 4,876 | 5,017 | ||||||||||||||||
| Slovakia | USD bil | 194 | 211 | 222 | 234 | 246 | ||||||||||||||||
| USA | USD bil | 22,996 | 25,035 | 26,185 | 27,057 | 28,045 | ||||||||||||||||
| Ukraine | USD bil | 588 | 584 | 615 | 650 | 689 | ... | ... |
 Helgi Library


