
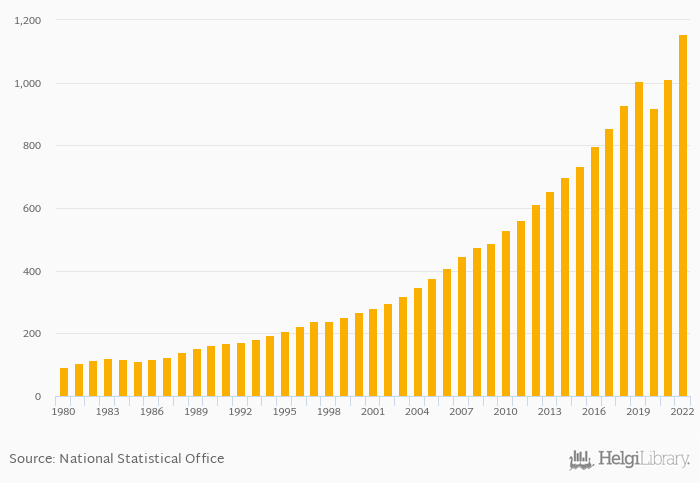
GDP in USD PPP terms rose 14.0% to USD 1,155 bil in Philippines in 2022, according to the National Statistical Office.
Historically, GDP in USD PPP terms in Philippines reached an all time high of USD 1,155 bil in 2022 and an all time low of USD 92.1 bil in 1980. When compared to Philippines's main peers, GDP in USD PPP terms in China amounted to USD 30,074 bil, USD 4,024 bil in Indonesia, USD 1,622 bil in Taiwan and USD 1,300 bil in Vietnam in 2022.
Philippines has been ranked 31st within the group of 173 countries we follow in terms of GDP in USD PPP terms.
| GDP PPP (Current USD) | Unit | 2007 | 2008 | 2009 | 2010 | 2011 | 2012 | 2013 | 2014 | 2015 | 2016 | 2017 | 2018 | 2019 | 2020 | 2021 | 2022 | 2023 | 2024 | 2025 | 2026 | 2027 |
| Australia | USD bil | 1,454 | 1,615 | 1,704 | 1,772 | 1,841 | ||||||||||||||||
| Cambodia | USD bil | 79.3 | 89.3 | 98.2 | 107 | 116 | ||||||||||||||||
| China | USD bil | 27,206 | 30,074 | 32,529 | 34,706 | 36,988 | ||||||||||||||||
| Hong Kong | USD bil | 488 | 519 | 558 | 587 | 615 | ||||||||||||||||
| India | USD bil | 10,194 | 11,665 | 12,813 | 13,973 | 15,197 | ||||||||||||||||
| Indonesia | USD bil | 3,566 | 4,024 | 4,374 | 4,706 | 5,049 | ||||||||||||||||
| Japan | USD bil | 5,607 | 6,110 | 6,430 | 6,653 | 6,839 | ||||||||||||||||
| Laos | USD bil | 62.6 | 68.6 | 73.2 | 77.6 | 82.1 | ||||||||||||||||
| Malaysia | USD bil | 971 | 1,097 | 1,185 | 1,270 | 1,350 | ||||||||||||||||
| Philippines | USD bil | 1,013 | 1,155 | 1,256 | 1,360 | 1,468 | ||||||||||||||||
| Russia | USD bil | 4,494 | 4,650 | 4,706 | 4,876 | 5,017 | ||||||||||||||||
| Singapore | USD bil | 635 | 701 | 742 | 778 | 812 | ||||||||||||||||
| Taiwan | USD bil | 1,466 | 1,622 | 1,727 | 1,801 | 1,871 | ||||||||||||||||
| Thailand | USD bil | 1,343 | 1,480 | 1,589 | 1,680 | 1,768 | ||||||||||||||||
| USA | USD bil | 22,996 | 25,035 | 26,185 | 27,057 | 28,045 | ||||||||||||||||
| Vietnam | USD bil | 1,134 | 1,300 | 1,429 | 1,555 | 1,690 |
 Helgi Library


