Follow us for the latest automotive news.
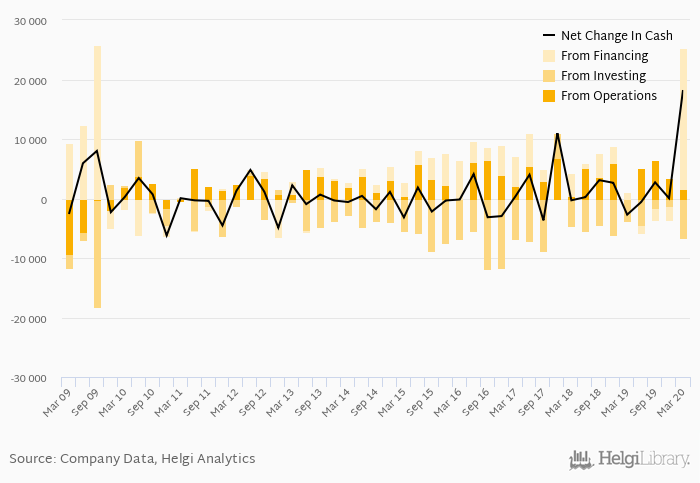
General Motors's operating cash flow stood at USD 1,561 mil in 1Q2020, up 2% when compared to the previous year. Historically, between 1Q2009 - 1Q2020, the firm’s operating cash flow reached a high of USD 6,888 mil in 4Q2017 and a low of USD -9,390 mil in 1Q2009.
General Motors's total investments stood at USD -6,570 mil and accounted for 3.74% of sales in 1Q2020. This is compared to an average of 5.60% as seen over the last five years.
Cash from financing amounted to USD 23,680 mil, so the company generated USD 18,223 mil net cash in 1Q2020.
At the end of 1Q2020, the company had a net debt of USD -1,745 mil, or -0.094x of EBITDA and -3.94% of equity. Net working capital amounted to USD 24,624 mil, or 75.3% of sales. Cash conversion cycle is negative and reached 60.6 days days in 1Q2020. This means General Motors generates revenue from customers before it has to pay its suppliers for inventory, among other things.
You can see all the company’s data at General Motors profile, or you can download a report on the company in the report section.
 Helgi Library