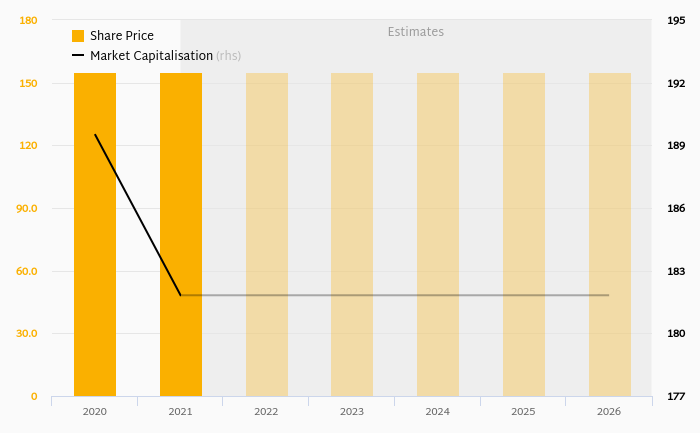
Gevorkyan stock traded at EUR 155 per share at the end 2021 translating into a market capitalization of USD 182 mil. Since the end of 2016, the stock has appreciated by 0% representing an annual average growth of %.
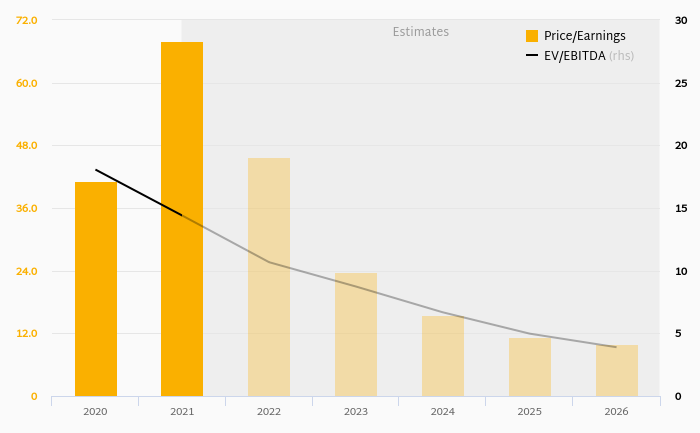
At the end of 2021, the firm traded at price to earnings of 67.9x. Over the last five years, this multiple achieved a high of 67.9x in 2021 and a low of 41.3x in 2020 with an average of 54.6x.
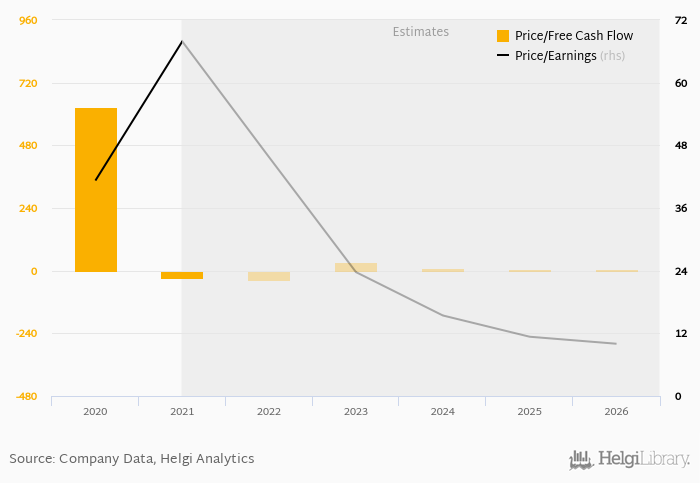
Regarding cash generated defined by the sum of net profit and depreciation, the stock traded at 15.6x at the end of 2021. When investments are excluded to get free cash flow, Gevorkyan traded at -29.3x.
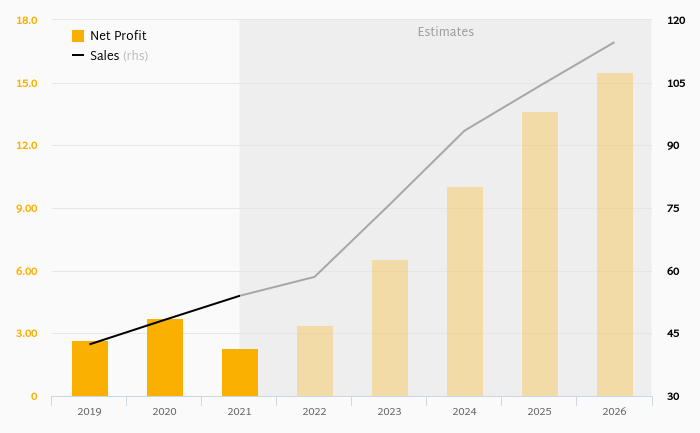
At the end of 2021, the company had a net debt of EUR 70.6 mil, or 4.60x of EBITDA and 191% of equity. The firm generated an average return on equity of 8.93% for its shareholders in the last five years and an average dividend yield of 0%.
You can see all the company’s data at Gevorkyan profile, or you can download a report on the company in the report section.
 Helgi Library