
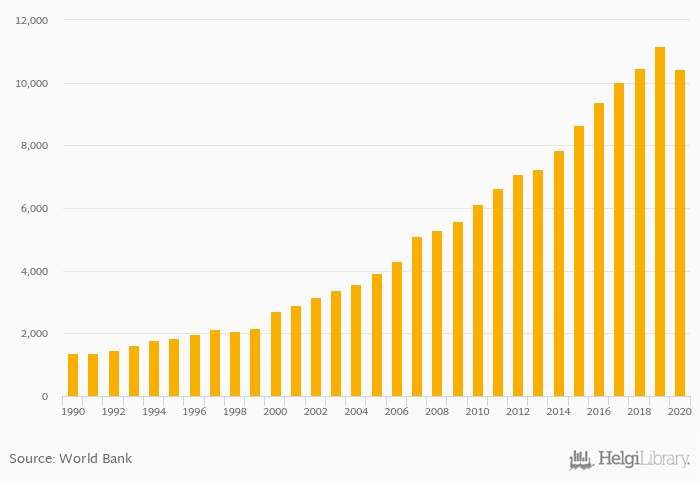
GNI per capita in PPP terms fell 6.62% to USD 10,440 in Bhutan in 2020, according to the National Statistical Office.
Historically, GNI per capita in PPP terms in Bhutan reached an all time high of USD 11,180 in 2019 and an all time low of USD 1,360 in 1991. When compared to Bhutan's main peers, GNI per capita in PPP terms in Bangladesh amounted to USD 6,140 , USD 17,050 in China, USD 6,360 in India and USD 4,010 in Nepal in 2020.
Bhutan has been ranked 101st within the group of 167 countries we follow in terms of GNI per capita in PPP terms, 14 places above the position seen 10 years ago.
| GNI Per Capita, PPP (Current USD) | Unit | 2001 | 2002 | 2003 | 2004 | 2005 | 2006 | 2007 | 2008 | 2009 | 2010 | 2011 | 2012 | 2013 | 2014 | 2015 | 2016 | 2017 | 2018 | 2019 | 2020 | 2021 |
| Bangladesh | USD | 4,450 | 4,770 | 5,000 | 5,460 | 5,930 | ||||||||||||||||
| Bhutan | USD | 8,640 | 9,390 | 10,030 | 10,470 | 11,180 | ||||||||||||||||
| China | USD | 12,840 | 13,420 | 14,220 | 15,430 | 16,610 | ||||||||||||||||
| India | USD | 5,350 | 5,660 | 6,050 | 6,520 | 6,820 | ||||||||||||||||
| Japan | USD | 42,510 | 42,010 | 42,980 | 43,730 | 43,930 | ||||||||||||||||
| Myanmar | USD | 4,030 | 3,990 | 4,200 | 4,530 | 4,860 | ||||||||||||||||
| Nepal | USD | 2,970 | 2,960 | 3,530 | 3,830 | 4,130 | ||||||||||||||||
| Pakistan | USD | 4,580 | 4,650 | 4,820 | 5,160 | 5,280 | ||||||||||||||||
| Russia | USD | 23,420 | 23,460 | 25,230 | 28,120 | 29,120 | ||||||||||||||||
| Sri Lanka | USD | 11,920 | 12,730 | 13,250 | 13,720 | 13,820 | ||||||||||||||||
| USA | USD | 58,180 | 58,870 | 61,190 | 64,090 | 66,120 |
 Helgi Library


