
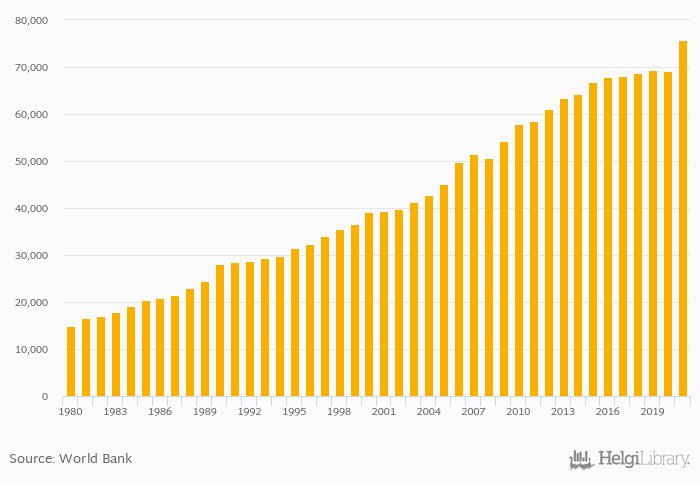
GNI per capita in PPP terms rose 9.62% to USD 75,810 in Switzerland in 2021, according to the National Statistical Office.
Historically, GNI per capita in PPP terms in Switzerland reached an all time high of USD 75,810 in 2021 and an all time low of USD 14,840 in 1980. When compared to Switzerland's main peers, GNI per capita in PPP terms in Austria amounted to USD 58,370 , USD 51,660 in France, USD 59,630 in Germany and USD 46,450 in Italy in 2021.
Switzerland has been ranked 5th within the group of 162 countries we follow in terms of GNI per capita in PPP terms, 5 places above the position seen 10 years ago.
| GNI Per Capita, PPP (Current USD) | Unit | 2001 | 2002 | 2003 | 2004 | 2005 | 2006 | 2007 | 2008 | 2009 | 2010 | 2011 | 2012 | 2013 | 2014 | 2015 | 2016 | 2017 | 2018 | 2019 | 2020 | 2021 |
| Austria | USD | 49,370 | 52,680 | 53,670 | 56,400 | 57,870 | ||||||||||||||||
| Belgium | USD | 46,850 | 49,060 | 50,900 | 52,990 | 54,790 | ||||||||||||||||
| France | USD | 41,730 | 43,830 | 45,580 | 47,620 | 50,020 | ||||||||||||||||
| Germany | USD | 48,690 | 51,830 | 54,340 | 57,010 | 57,460 | ||||||||||||||||
| Hungary | USD | 25,520 | 27,190 | 28,310 | 30,660 | 32,630 | ||||||||||||||||
| Italy | USD | 36,640 | 40,040 | 41,810 | 43,510 | 44,750 | ||||||||||||||||
| Poland | USD | 25,820 | 27,070 | 28,690 | 30,680 | 32,320 | ||||||||||||||||
| Slovenia | USD | 30,650 | 33,080 | 35,850 | 38,380 | 40,060 | ||||||||||||||||
| Spain | USD | 34,900 | 37,380 | 39,540 | 40,750 | 41,790 | ||||||||||||||||
| Switzerland | USD | 66,830 | 67,820 | 68,170 | 68,800 | 69,440 |
 Helgi Library


