
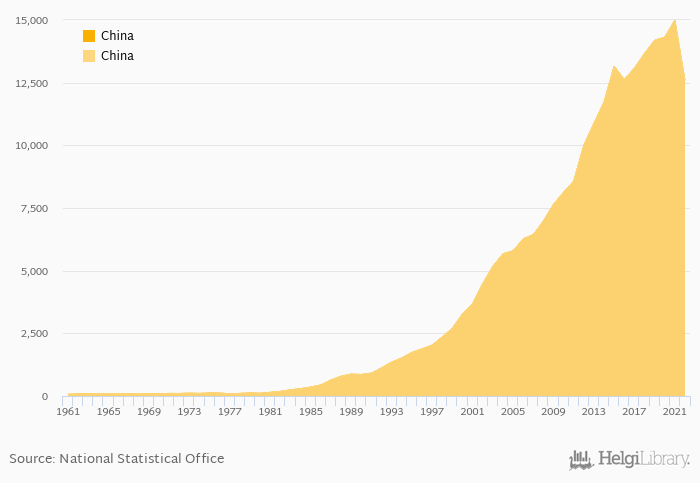
Grape production fell 16.0% to 12,600 kt in China in 2022, according to Faostat.
Historically, grape production in China reached an all time high of 14,998 kt in 2021 and an all time low of 70.0 kt in 1961. When compared to China's main peers, grape production in India amounted to 3,401 kt, 163 kt in Japan, 890 kt in Russia and 5,373 kt in USA in 2022.
China has been ranked 1st within the group of 91 countries we follow in terms of grape production.
| Grape Production | Unit | 2002 | 2003 | 2004 | 2005 | 2006 | 2007 | 2008 | 2009 | 2010 | 2011 | 2012 | 2013 | 2014 | 2015 | 2016 | 2017 | 2018 | 2019 | 2020 | 2021 | 2022 |
| Bangladesh | kt | ... | ... | ... | ... | ... | ... | ... | ... | ... | ... | ... | ... | ... | ... | ... | ... | ... | ... | ... | ... | ... |
| Canada | kt | 106 | 131 | 108 | 122 | 105 | ||||||||||||||||
| China | kt | 12,629 | 13,083 | 13,667 | 14,195 | 14,314 | ||||||||||||||||
| Germany | kt | 1,226 | 1,014 | 1,404 | 1,125 | 1,150 | ||||||||||||||||
| India | kt | 2,590 | 2,922 | 2,920 | 3,041 | 3,181 | ||||||||||||||||
| Japan | kt | 179 | 176 | 175 | 173 | 163 | ||||||||||||||||
| Mexico | kt | 337 | 405 | 431 | 473 | 454 | ||||||||||||||||
| Pakistan | kt | 66.2 | 67.0 | 68.5 | 82.2 | 89.5 | ||||||||||||||||
| Russia | kt | 601 | 580 | 628 | 678 | 682 | ||||||||||||||||
| South Korea | kt | 229 | 190 | 175 | 166 | 166 | ||||||||||||||||
| Sri Lanka | kt | ... | ... | ... | ... | ... | ... | ... | ... | ... | ... | ... | ... | ... | ... | ... | ... | ... | ... | ... | ... | ... |
| USA | kt | 6,983 | 6,699 | 6,891 | 6,315 | 5,479 |
 Helgi Library


