
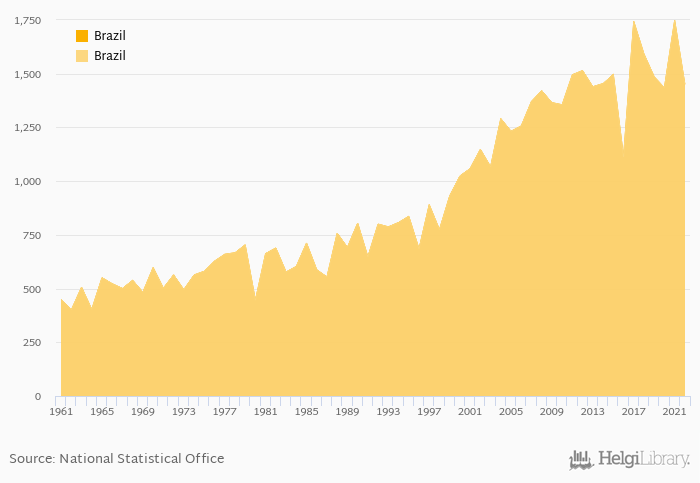
Grape production fell 17.0% to 1,451 kt in Brazil in 2022, according to Faostat.
Historically, grape production in Brazil reached an all time high of 1,748 kt in 2021 and an all time low of 401 kt in 1962. When compared to Brazil's main peers, grape production in Bolivia amounted to 27.5 kt, 919 kt in Peru and 21.1 kt in Venezuela in 2022.
Brazil has been ranked 13th within the group of 91 countries we follow in terms of grape production.
| Grape Production | Unit | 2002 | 2003 | 2004 | 2005 | 2006 | 2007 | 2008 | 2009 | 2010 | 2011 | 2012 | 2013 | 2014 | 2015 | 2016 | 2017 | 2018 | 2019 | 2020 | 2021 | 2022 |
| Bolivia | kt | 21.2 | 22.1 | 22.7 | 23.5 | 22.2 | ||||||||||||||||
| Brazil | kt | 1,113 | 1,743 | 1,592 | 1,486 | 1,436 | ||||||||||||||||
| Chile | kt | 2,479 | 2,383 | 2,828 | 2,715 | 2,435 | ||||||||||||||||
| Colombia | kt | 29.2 | 30.3 | 57.5 | 67.6 | 28.0 | ||||||||||||||||
| Guyana | kt | ... | ... | ... | ... | ... | ... | ... | ... | ... | ... | ... | ... | ... | ... | ... | ... | ... | ... | ... | ... | ... |
| Paraguay | kt | 1.92 | 1.93 | 1.93 | 1.93 | 1.93 | ||||||||||||||||
| Peru | kt | 690 | 645 | 646 | 640 | 733 | ||||||||||||||||
| Trinidad and Tobago | kt | ... | ... | ... | ... | ... | ... | ... | ... | ... | ... | ... | ... | ... | ... | ... | ... | ... | ... | ... | ... | ... |
| Venezuela | kt | 19.0 | 20.1 | 19.7 | 20.4 | 19.4 |
 Helgi Library


