
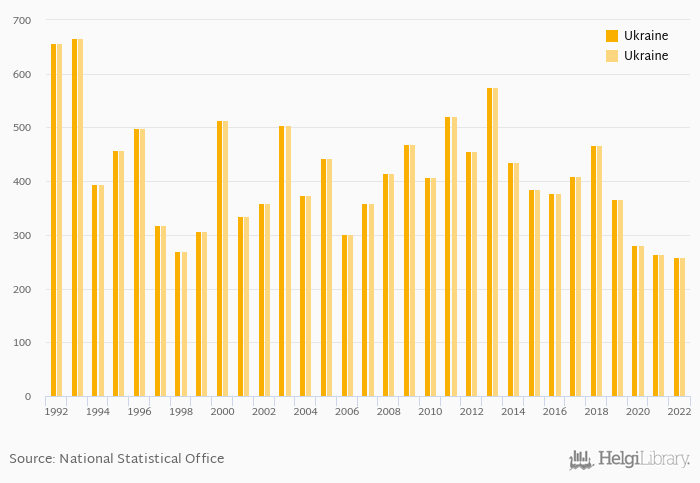
Grape production fell 2.36% to 258 kt in Ukraine in 2022, according to Faostat.
Historically, grape production in Ukraine reached an all time high of 666 kt in 1993 and an all time low of 258 kt in 2022. When compared to Ukraine's main peers, grape production in Poland amounted to 5.20 kt, 805 kt in Romania and 890 kt in Russia in 2022.
Ukraine has been ranked 34th within the group of 91 countries we follow in terms of grape production, 11 places below the position seen 10 years ago.
| Grape Production | Unit | 2002 | 2003 | 2004 | 2005 | 2006 | 2007 | 2008 | 2009 | 2010 | 2011 | 2012 | 2013 | 2014 | 2015 | 2016 | 2017 | 2018 | 2019 | 2020 | 2021 | 2022 |
| Bulgaria | kt | 211 | 202 | 202 | 179 | 159 | ||||||||||||||||
| China | kt | 12,629 | 13,083 | 13,667 | 14,195 | 14,314 | ||||||||||||||||
| Czechia | kt | 75.9 | 79.8 | 104 | 68.0 | 90.4 | ||||||||||||||||
| Germany | kt | 1,226 | 1,014 | 1,404 | 1,125 | 1,150 | ||||||||||||||||
| Hungary | kt | 476 | 530 | 533 | 457 | 435 | ||||||||||||||||
| Japan | kt | 179 | 176 | 175 | 173 | 163 | ||||||||||||||||
| Moldova | kt | 616 | 675 | 730 | 659 | 462 | ||||||||||||||||
| Poland | kt | ... | ... | ... | ... | ... | ... | ... | ... | ... | ... | ... | ... | ... | ... | ... | ... | 3.92 | 3.21 | 3.60 | ||
| Romania | kt | 737 | 1,067 | 1,141 | 974 | 933 | ||||||||||||||||
| Russia | kt | 601 | 580 | 628 | 678 | 682 | ||||||||||||||||
| USA | kt | 6,983 | 6,699 | 6,891 | 6,315 | 5,479 | ||||||||||||||||
| Ukraine | kt | 378 | 410 | 468 | 366 | 281 |
 Helgi Library


