
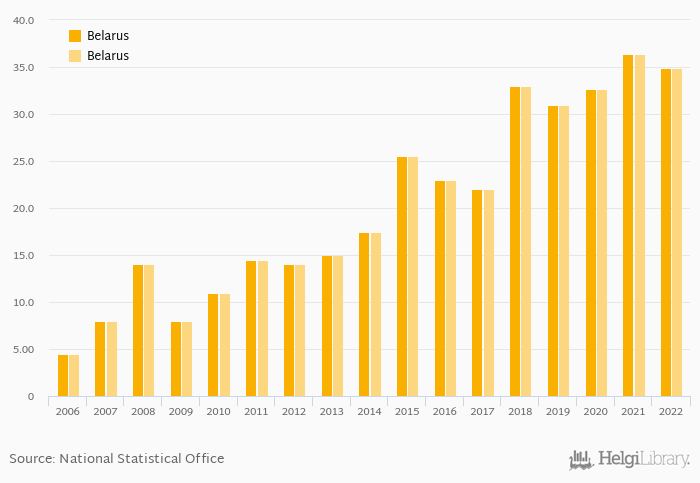
Grape production fell 4.10% to 34.9 kt in Belarus in 2022, according to Faostat.
Historically, grape production in Belarus reached an all time high of 36.4 kt in 2021 and an all time low of 4.50 kt in 2006.
Belarus has been ranked 61st within the group of 91 countries we follow in terms of grape production, 12 places above the position seen 10 years ago.
| Grape Production | Unit | 2002 | 2003 | 2004 | 2005 | 2006 | 2007 | 2008 | 2009 | 2010 | 2011 | 2012 | 2013 | 2014 | 2015 | 2016 | 2017 | 2018 | 2019 | 2020 | 2021 | 2022 |
| Belarus | kt | ... | ... | ... | ... | 23.0 | 22.0 | 33.0 | 31.0 | 32.7 | ||||||||||||
| China | kt | 12,629 | 13,083 | 13,667 | 14,195 | 14,314 | ||||||||||||||||
| Czechia | kt | 75.9 | 79.8 | 104 | 68.0 | 90.4 | ||||||||||||||||
| Estonia | kt | ... | ... | ... | ... | ... | ... | ... | ... | ... | ... | ... | ... | ... | ... | ... | ... | ... | ... | ... | ... | ... |
| Germany | kt | 1,226 | 1,014 | 1,404 | 1,125 | 1,150 | ||||||||||||||||
| Japan | kt | 179 | 176 | 175 | 173 | 163 | ||||||||||||||||
| Latvia | kt | ... | ... | ... | ... | ... | ... | ... | ... | ... | ... | ... | ... | ... | ... | ... | ... | ... | ... | ... | ... | ... |
| Lithuania | kt | ... | ... | ... | ... | ... | ... | ... | ... | ... | ... | ... | ... | ... | ... | ... | ... | ... | ... | ... | ... | ... |
| Poland | kt | ... | ... | ... | ... | ... | ... | ... | ... | ... | ... | ... | ... | ... | ... | ... | ... | 3.92 | 3.21 | 3.60 | ||
| Romania | kt | 737 | 1,067 | 1,141 | 974 | 933 | ||||||||||||||||
| Russia | kt | 601 | 580 | 628 | 678 | 682 | ||||||||||||||||
| USA | kt | 6,983 | 6,699 | 6,891 | 6,315 | 5,479 | ||||||||||||||||
| Ukraine | kt | 378 | 410 | 468 | 366 | 281 |
 Helgi Library


