
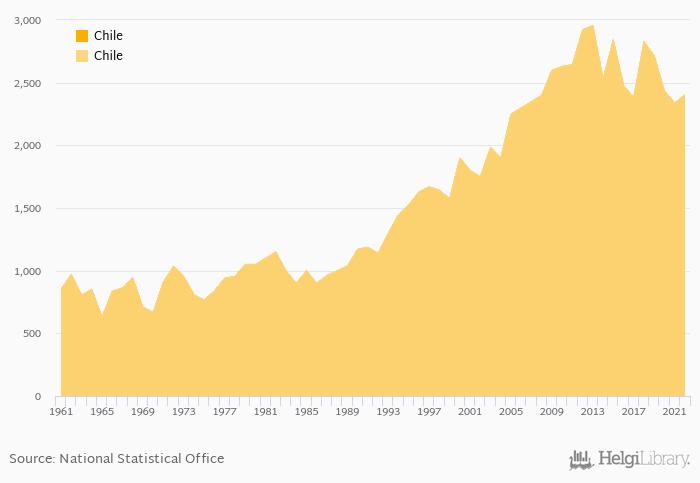
Grape production rose 2.71% to 2,403 kt in Chile in 2022, according to Faostat.
Historically, grape production in Chile reached an all time high of 2,955 kt in 2013 and an all time low of 630 kt in 1965. When compared to Chile's main peers, grape production in Argentina amounted to 1,937 kt, 27.5 kt in Bolivia, 1.93 kt in Paraguay and 107 kt in Uruguay in 2022.
Chile has been ranked 8th within the group of 91 countries we follow in terms of grape production, 1 place below the position seen 10 years ago.
| Grape Production | Unit | 2002 | 2003 | 2004 | 2005 | 2006 | 2007 | 2008 | 2009 | 2010 | 2011 | 2012 | 2013 | 2014 | 2015 | 2016 | 2017 | 2018 | 2019 | 2020 | 2021 | 2022 |
| Argentina | kt | 1,758 | 1,965 | 2,573 | 2,520 | 2,056 | ||||||||||||||||
| Bolivia | kt | 21.2 | 22.1 | 22.7 | 23.5 | 22.2 | ||||||||||||||||
| Brazil | kt | 1,113 | 1,743 | 1,592 | 1,486 | 1,436 | ||||||||||||||||
| Chile | kt | 2,479 | 2,383 | 2,828 | 2,715 | 2,435 | ||||||||||||||||
| Paraguay | kt | 1.92 | 1.93 | 1.93 | 1.93 | 1.93 | ||||||||||||||||
| Peru | kt | 690 | 645 | 646 | 640 | 733 | ||||||||||||||||
| Uruguay | kt | 105 | 95.7 | 105 | 86.2 | 96.8 |
 Helgi Library


