
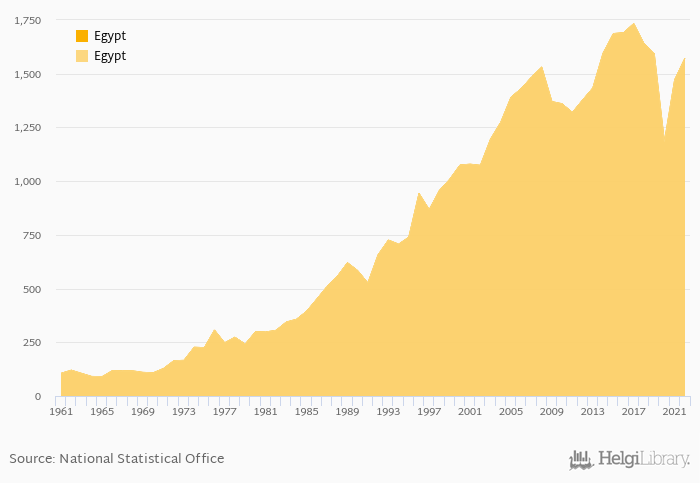
Grape production rose 6.76% to 1,572 kt in Egypt in 2022, according to Faostat.
Historically, grape production in Egypt reached an all time high of 1,734 kt in 2017 and an all time low of 90.0 kt in 1965.
Egypt has been ranked 12th within the group of 91 countries we follow in terms of grape production, 2 places above the position seen 10 years ago.
| Grape Production | Unit | 2002 | 2003 | 2004 | 2005 | 2006 | 2007 | 2008 | 2009 | 2010 | 2011 | 2012 | 2013 | 2014 | 2015 | 2016 | 2017 | 2018 | 2019 | 2020 | 2021 | 2022 |
| Algeria | kt | 571 | 567 | 503 | 550 | 554 | ||||||||||||||||
| Chad | kt | ... | ... | ... | ... | ... | ... | ... | ... | ... | ... | ... | ... | ... | ... | ... | ... | ... | ... | ... | ... | ... |
| Egypt | kt | 1,691 | 1,734 | 1,641 | 1,595 | 1,184 | ||||||||||||||||
| Ethiopia | kt | 4.91 | 4.92 | 4.76 | 4.86 | 4.85 | ||||||||||||||||
| Iraq | kt | 94.1 | 99.4 | 123 | 420 | 422 | ||||||||||||||||
| Israel | kt | 66.0 | 68.5 | 63.0 | 57.1 | 46.2 | ||||||||||||||||
| Jordan | kt | 62.3 | 53.5 | 59.8 | 53.9 | 43.0 | ||||||||||||||||
| Lebanon | kt | 119 | 77.4 | 51.7 | 62.0 | 63.0 | ||||||||||||||||
| Libya | kt | 32.2 | 32.3 | 31.5 | 1.41 | 31.4 | ||||||||||||||||
| Saudi Arabia | kt | 41.4 | 44.5 | 44.8 | 118 | 102 | ||||||||||||||||
| South Sudan | kt | ... | ... | ... | ... | ... | ... | ... | ... | ... | ... | ... | ... | ... | ... | ... | ... | ... | ... | ... | ... | ... |
| Sudan | kt | ... | ... | ... | ... | ... | ... | ... | ... | ... | ... | ... | ... | ... | ... | ... | ... | ... | ... | ... | ... | ... |
| Syria | kt | 213 | 239 | 223 | 252 | 243 | ||||||||||||||||
| Tunisia | kt | 134 | 147 | 154 | 148 | 150 | ||||||||||||||||
| United Arab Emirates | kt | 0.036 | 0.034 | 0.035 | 0.035 | 0.035 | ||||||||||||||||
| Yemen | kt | 130 | 130 | 123 | 134 | 137 |
 Helgi Library


