
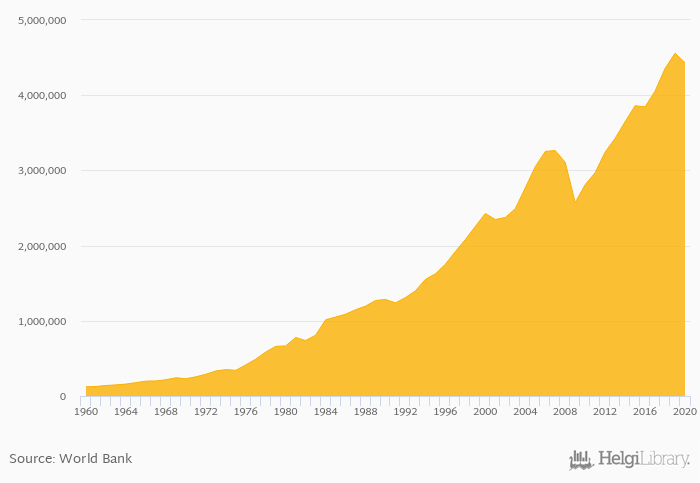
Gross capital formation fell 2.74% to USD 4,433,432 bil in the USA in 2020, according to the National Statistical Office.
Historically, gross capital formation in the USA reached an all time high of USD 4,558,260 bil in 2019 and an all time low of USD 122,400 bil in 1960. When compared to USA's main peers, gross capital formation in Canada amounted to USD 366,223 bil, USD 6,369,556 bil in China, USD 1,280,939 bil in Japan and USD 209,266 bil in Mexico in 2020.
USA has been ranked 2nd within the group of 157 countries we follow in terms of gross capital formation.
| Gross Capital Formation (USD) | Unit | 2001 | 2002 | 2003 | 2004 | 2005 | 2006 | 2007 | 2008 | 2009 | 2010 | 2011 | 2012 | 2013 | 2014 | 2015 | 2016 | 2017 | 2018 | 2019 | 2020 | 2021 |
| Australia | USD bil | 354,954 | 306,658 | 319,788 | 350,780 | 324,420 | ||||||||||||||||
| Belize | USD bil | 367 | 403 | 342 | 380 | 406 | ||||||||||||||||
| Canada | USD bil | 370,785 | 347,789 | 388,410 | 399,475 | 400,360 | ||||||||||||||||
| China | USD bil | 4,782,441 | 4,788,900 | 5,295,113 | 6,085,023 | 6,176,231 | ||||||||||||||||
| Guatemala | USD bil | 9,221 | 9,156 | 9,742 | 10,112 | 11,033 | ||||||||||||||||
| Honduras | USD bil | 5,270 | 5,077 | 5,743 | 6,395 | 5,703 | ||||||||||||||||
| India | USD bil | 675,604 | 692,402 | 821,484 | 874,214 | 855,724 | ||||||||||||||||
| Japan | USD bil | 1,118,582 | 1,242,693 | 1,243,302 | 1,289,433 | 1,322,667 | ||||||||||||||||
| Mexico | USD bil | 273,198 | 254,754 | 265,449 | 277,626 | 268,525 | ||||||||||||||||
| Russia | USD bil | 301,994 | 294,879 | 371,617 | 363,255 | 383,685 | ||||||||||||||||
| South Korea | USD bil | 432,832 | 452,174 | 524,326 | 543,105 | 520,115 | ||||||||||||||||
| USA | USD bil | 3,859,763 | 3,844,982 | 4,053,902 | 4,354,223 | 4,558,260 | ||||||||||||||||
| United Kingdom | USD bil | 521,371 | 484,283 | 492,408 | 520,996 | 521,895 |
 Helgi Library


