
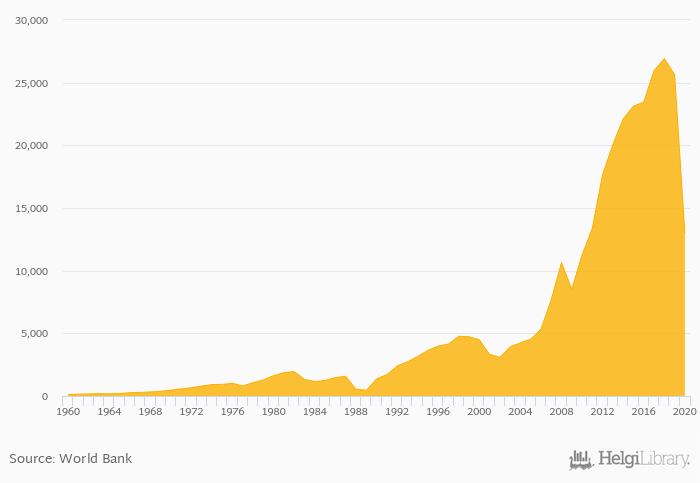
Gross capital formation fell 49.4% to USD 12,986 bil in Panama in 2020, according to the National Statistical Office.
Historically, gross capital formation in Panama reached an all time high of USD 26,933 bil in 2018 and an all time low of USD 114 bil in 1960. When compared to Panama's main peers, gross capital formation in Colombia amounted to USD 52,017 bil, USD 9,823 bil in Costa Rica, USD 4,488 bil in Honduras and USD 2,424 bil in Nicaragua in 2020.
Panama has been ranked 75th within the group of 157 countries we follow in terms of gross capital formation.
| Gross Capital Formation (USD) | Unit | 2001 | 2002 | 2003 | 2004 | 2005 | 2006 | 2007 | 2008 | 2009 | 2010 | 2011 | 2012 | 2013 | 2014 | 2015 | 2016 | 2017 | 2018 | 2019 | 2020 | 2021 |
| Belize | USD bil | 367 | 403 | 342 | 380 | 406 | ||||||||||||||||
| Brazil | USD bil | 313,795 | 268,808 | 301,800 | 289,364 | 290,672 | ||||||||||||||||
| Colombia | USD bil | 69,771 | 65,523 | 67,365 | 70,835 | 69,083 | ||||||||||||||||
| Costa Rica | USD bil | 10,641 | 11,116 | 10,932 | 11,466 | 10,348 | ||||||||||||||||
| El Salvador | USD bil | 3,754 | 3,863 | 4,166 | 4,780 | 4,931 | ||||||||||||||||
| Guatemala | USD bil | 9,221 | 9,156 | 9,742 | 10,112 | 11,033 | ||||||||||||||||
| Honduras | USD bil | 5,270 | 5,077 | 5,743 | 6,395 | 5,703 | ||||||||||||||||
| Mexico | USD bil | 273,198 | 254,754 | 265,449 | 277,626 | 268,525 | ||||||||||||||||
| Nicaragua | USD bil | 4,270 | 4,145 | 4,124 | 3,136 | 2,188 | ||||||||||||||||
| Panama | USD bil | 23,127 | 23,452 | 25,958 | 26,933 | 25,657 | ||||||||||||||||
| Peru | USD bil | 46,132 | 42,258 | 43,703 | 47,438 | 47,568 | ||||||||||||||||
| USA | USD bil | 3,859,763 | 3,844,982 | 4,053,902 | 4,354,223 | 4,558,260 | ||||||||||||||||
| Venezuela | USD bil | ... | ... | ... | ... | ... | ... | ... |
 Helgi Library


