
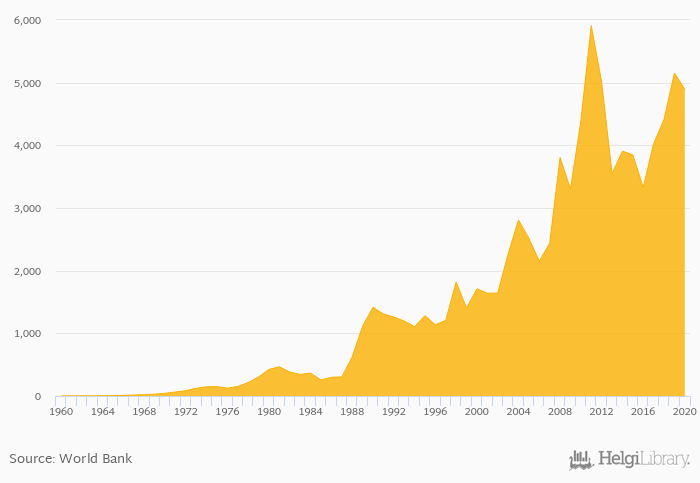
Gross capital formation fell 5.02% to USD 4,896 bil in Botswana in 2020, according to the National Statistical Office.
Historically, gross capital formation in Botswana reached an all time high of USD 5,911 bil in 2011 and an all time low of USD 1.83 bil in 1960. When compared to Botswana's main peers, gross capital formation in Namibia amounted to USD 1,449 bil, USD 41,865 bil in South Africa, USD 5,848 bil in Zambia and USD 2,828 bil in Zimbabwe in 2020.
Botswana has been ranked 104th within the group of 157 countries we follow in terms of gross capital formation, 1 place below the position seen 10 years ago.
| Gross Capital Formation (USD) | Unit | 2001 | 2002 | 2003 | 2004 | 2005 | 2006 | 2007 | 2008 | 2009 | 2010 | 2011 | 2012 | 2013 | 2014 | 2015 | 2016 | 2017 | 2018 | 2019 | 2020 | 2021 |
| Angola | USD bil | 29,831 | 13,564 | 16,643 | 13,901 | 12,276 | ||||||||||||||||
| Botswana | USD bil | 3,849 | 3,328 | 4,027 | 4,412 | 5,155 | ||||||||||||||||
| Dem. Republic of the Congo | USD bil | 7,025 | 6,461 | 9,500 | 9,800 | 10,663 | ||||||||||||||||
| Lesotho | USD bil | 718 | 608 | 512 | 578 | 645 | ... | |||||||||||||||
| Mozambique | USD bil | 6,580 | 5,563 | 4,387 | 7,430 | 9,243 | ||||||||||||||||
| Namibia | USD bil | 3,464 | 2,362 | 2,291 | 2,041 | 1,923 | ||||||||||||||||
| South Africa | USD bil | 64,603 | 54,882 | 63,361 | 65,427 | 61,595 | ||||||||||||||||
| Swaziland | USD bil | 509 | 490 | 565 | 618 | 610 | ||||||||||||||||
| Tanzania | USD bil | 15,521 | 16,015 | 18,138 | 21,876 | 24,244 | ||||||||||||||||
| Zambia | USD bil | ... | ... | ... | ... | ... | ... | ... | ... | ... | 9,097 | 8,007 | 10,609 | 10,167 | 9,151 | |||||||
| Zimbabwe | USD bil | 2,003 | 2,026 | 1,706 | 4,833 | 3,013 |
 Helgi Library


