
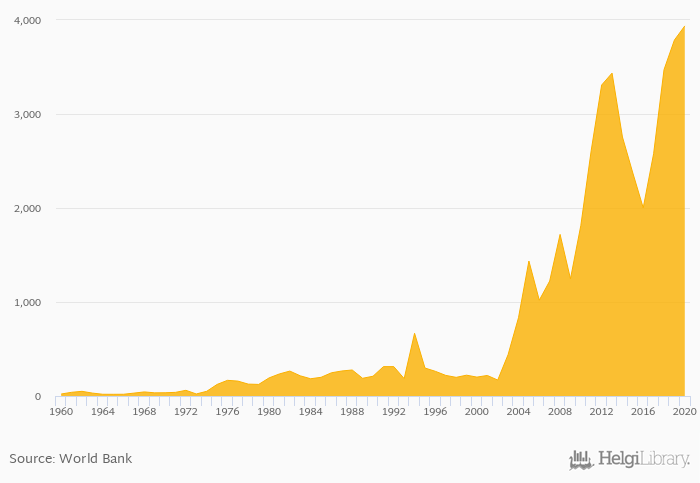
Gross capital formation rose 3.98% to USD 3,937 bil in Mauritania in 2020, according to the National Statistical Office.
Historically, gross capital formation in Mauritania reached an all time high of USD 3,937 bil in 2020 and an all time low of USD 18.0 bil in 1965. When compared to Mauritania's main peers, gross capital formation in Algeria amounted to USD 60,689 bil, USD 2,876 bil in Mali, USD 34,922 bil in Morocco and USD 8,608 bil in Senegal in 2020.
Mauritania has been ranked 111th within the group of 157 countries we follow in terms of gross capital formation, 29 places above the position seen 10 years ago.
| Gross Capital Formation (USD) | Unit | 2001 | 2002 | 2003 | 2004 | 2005 | 2006 | 2007 | 2008 | 2009 | 2010 | 2011 | 2012 | 2013 | 2014 | 2015 | 2016 | 2017 | 2018 | 2019 | 2020 | 2021 |
| Algeria | USD bil | 84,285 | 81,262 | 82,571 | 82,332 | 76,766 | ||||||||||||||||
| Burkina Faso | USD bil | 2,296 | 2,669 | 3,112 | 3,454 | 3,593 | ... | ... | ||||||||||||||
| Gambia | USD bil | 280 | 370 | 346 | 349 | 400 | ||||||||||||||||
| Guinea | USD bil | 2,125 | 4,527 | 2,299 | 2,318 | 2,652 | ||||||||||||||||
| Libya | USD bil | 8,468 | 6,888 | 9,206 | 11,605 | 9,808 | ... | ... | ||||||||||||||
| Mali | USD bil | 2,721 | 3,361 | 3,317 | 3,492 | 3,894 | ||||||||||||||||
| Mauritania | USD bil | 2,372 | 2,001 | 2,577 | 3,471 | 3,787 | ||||||||||||||||
| Morocco | USD bil | 33,320 | 35,656 | 37,528 | 40,927 | 39,443 | ||||||||||||||||
| Niger | USD bil | 3,133 | 2,862 | 2,910 | 3,712 | 3,954 | ||||||||||||||||
| Senegal | USD bil | 4,592 | 4,829 | 6,260 | 7,547 | 7,476 | ||||||||||||||||
| Spain | USD bil | 227,120 | 231,212 | 254,779 | 290,991 | 290,429 | ||||||||||||||||
| Tunisia | USD bil | 9,952 | 9,083 | 8,979 | 9,802 | 8,299 |
 Helgi Library


