
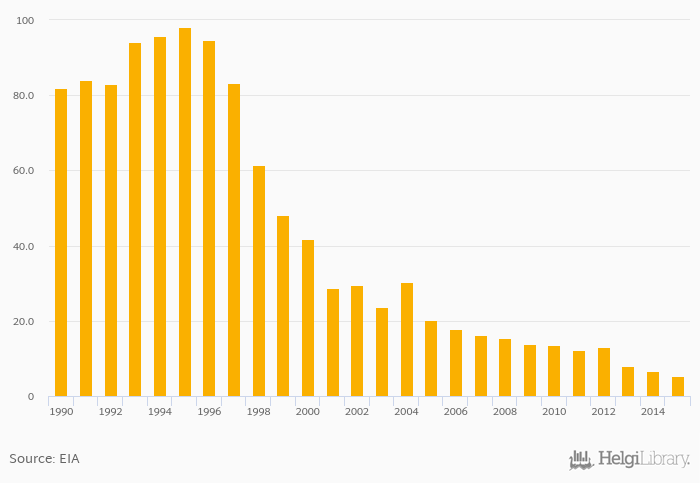
Gross natural gas production fell 18.7% to 5.37 bil cb ft in Ireland in 2015, according to EIA.
Historically, gross natural gas production in Ireland reached an all time high of 98.1 bil cb ft in 1995 and an all time low of 5.37 bil cb ft in 2015.
Ireland has been ranked 59th within the group of 70 countries we follow in terms of gross natural gas production, 12 places above the position seen 10 years ago.
| Gross Natural Gas Production | Unit | 1995 | 1996 | 1997 | 1998 | 1999 | 2000 | 2001 | 2002 | 2003 | 2004 | 2005 | 2006 | 2007 | 2008 | 2009 | 2010 | 2011 | 2012 | 2013 | 2014 | 2015 |
| Australia | bil cb ft | 1,500 | 1,716 | 1,818 | 1,902 | 1,917 | ||||||||||||||||
| Belgium | bil cb ft | ... | ... | ... | ... | ... | ... | ... | ... | ... | ... | ... | ... | ... | ... | ... | ... | ... | ... | ... | ||
| Canada | bil cb ft | 6,928 | 6,695 | 6,669 | 6,307 | 6,307 | ||||||||||||||||
| Denmark | bil cb ft | 300 | 295 | 253 | 227 | 206 | ||||||||||||||||
| France | bil cb ft | 48.7 | 47.7 | 39.6 | 36.7 | 36.2 | ||||||||||||||||
| Germany | bil cb ft | 663 | 563 | 561 | 434 | 497 | ||||||||||||||||
| Iceland | bil cb ft | ... | ... | ... | ... | ... | ... | ... | ... | ... | ... | ... | ... | ... | ... | ... | ... | ... | ... | ... | ... | ... |
| Ireland | bil cb ft | 13.8 | 13.7 | 12.3 | 13.1 | 7.88 | ||||||||||||||||
| Italy | bil cb ft | 283 | 297 | 298 | 304 | 304 | ||||||||||||||||
| Mexico | bil cb ft | 1,977 | 1,952 | 1,872 | 1,684 | 2,337 | ||||||||||||||||
| Norway | bil cb ft | 5,114 | 5,253 | 5,196 | 5,673 | ... | ... | ... | ||||||||||||||
| Spain | bil cb ft | 0.494 | 1.80 | 1.84 | 2.15 | 2.15 | ||||||||||||||||
| Sweden | bil cb ft | ... | ... | ... | ... | ... | ... | ... | ... | ... | ... | ... | ... | ... | ... | ... | ... | ... | ... | ... | ... | |
| USA | bil cb ft | 26,057 | 26,836 | 28,479 | 29,542 | 29,542 | ||||||||||||||||
| United Kingdom | bil cb ft | 2,269 | 2,171 | 1,742 | 1,519 | 1,498 |
 Helgi Library


