
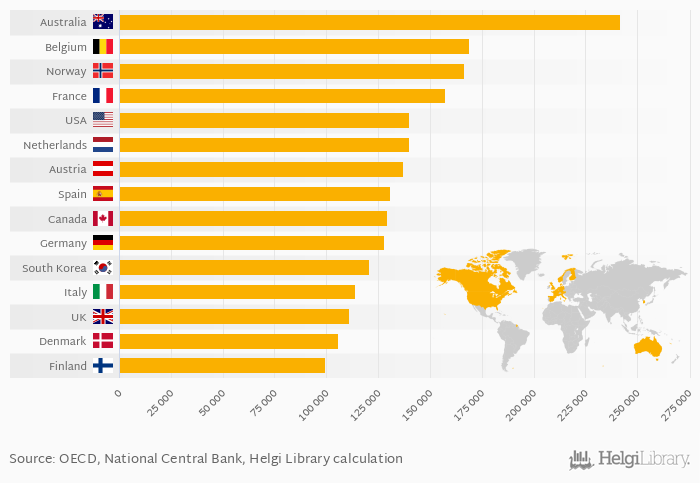
Based on a comparison of 25 countries in 2020, Australia ranked the highest in households' non-financial assets per capita with USD 241,682 followed by Belgium and Norway. On the other end of the scale was Poland with USD 11,077, Mexico with USD 15,157 and Lithuania with USD 23,726.
Data for more countries are available at Households' Non-Financial Assets Per Capita (USD) indicator page.
| Households' Non-Financial Assets Per Capita (USD) | Unit | 2000 | 2001 | 2002 | 2003 | 2004 | 2005 | 2006 | 2007 | 2008 | 2009 | 2010 | 2011 | 2012 | 2013 | 2014 | 2015 | 2016 | 2017 | 2018 | 2019 | 2020 |
| Australia | USD | 220,840 | 191,920 | 208,622 | 215,162 | 202,506 | ||||||||||||||||
| Austria | USD | 117,840 | 104,356 | 105,530 | 111,138 | 122,104 | ||||||||||||||||
| Belgium | USD | 154,094 | 135,345 | 136,146 | 141,800 | 153,654 | ||||||||||||||||
| Canada | USD | 115,024 | 105,820 | 109,762 | 116,629 | 116,250 | ||||||||||||||||
| Denmark | USD | 101,895 | 89,176 | 91,321 | 95,082 | 103,532 | ||||||||||||||||
| Finland | USD | 90,950 | 76,767 | 78,306 | 82,778 | 92,010 | ||||||||||||||||
| France | USD | 135,256 | 113,678 | 116,715 | 123,600 | 135,201 | ||||||||||||||||
| Germany | USD | 105,515 | 91,806 | 95,037 | 101,702 | 113,529 | ||||||||||||||||
| Italy | USD | 133,220 | 109,151 | 107,740 | 108,887 | 113,272 | ||||||||||||||||
| Netherlands | USD | 105,410 | 90,895 | 95,823 | 105,146 | 121,270 | ||||||||||||||||
| Norway | USD | 181,911 | 152,000 | 157,038 | 173,760 | 190,173 | ||||||||||||||||
| South Korea | USD | 92,191 | 90,070 | 92,612 | 101,384 | 112,307 | ||||||||||||||||
| Spain | USD | 117,910 | 103,823 | 108,527 | 118,300 | 129,781 | ||||||||||||||||
| USA | USD | 96,450 | 103,029 | 108,729 | 116,200 | 121,527 | ||||||||||||||||
| United Kingdom | USD | 111,810 | 111,574 | 103,542 | 102,274 | 106,547 |
 Helgi Library


