
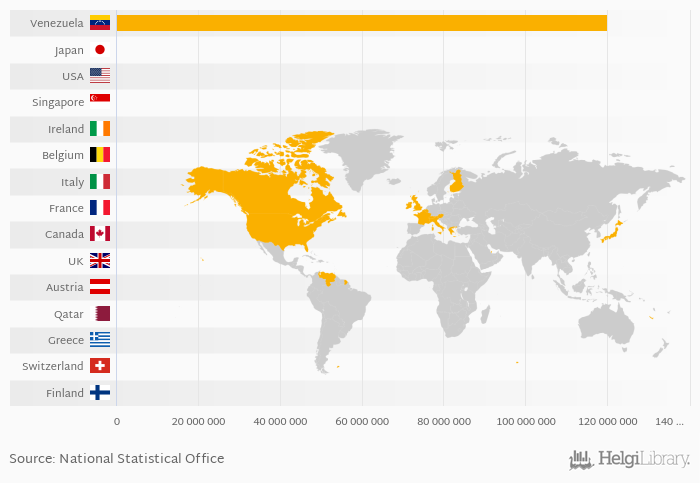
Based on a comparison of 167 countries in 2020, Venezuela ranked the highest in public debt per capita with USD 119,993,679 followed by Japan and USA. On the other end of the scale was Macao with USD 0, Hong Kong with USD 0 and Afghanistan with USD 43.8.
Data for more countries are available at Public Debt Per Capita (USD) indicator page.
| Public Debt Per Capita (USD) | Unit | 2003 | 2004 | 2005 | 2006 | 2007 | 2008 | 2009 | 2010 | 2011 | 2012 | 2013 | 2014 | 2015 | 2016 | 2017 | 2018 | 2019 | 2020 | 2021 | 2022 | 2023 |
| Austria | USD | 38,516 | 39,865 | 37,567 | 38,005 | 40,721 | ||||||||||||||||
| Belgium | USD | 45,912 | 48,551 | 46,776 | 48,487 | 52,959 | ||||||||||||||||
| Canada | USD | 41,072 | 41,446 | 40,639 | 40,177 | 41,255 | ||||||||||||||||
| Finland | USD | 28,554 | 30,688 | 29,944 | 31,238 | 34,421 | ||||||||||||||||
| France | USD | 38,629 | 41,406 | 40,305 | 42,065 | 46,387 | ||||||||||||||||
| Greece | USD | 33,248 | 37,198 | 34,407 | 34,980 | 37,479 | ||||||||||||||||
| Ireland | USD | 47,810 | 50,753 | 48,375 | 48,630 | 52,971 | ||||||||||||||||
| Italy | USD | 42,214 | 44,802 | 43,110 | 44,763 | 49,052 | ||||||||||||||||
| Japan | USD | 92,731 | 96,656 | 100,088 | 103,800 | 107,108 | ||||||||||||||||
| Qatar | USD | 36,871 | 40,865 | 40,145 | 37,859 | 36,198 | ||||||||||||||||
| Singapore | USD | 63,464 | 67,711 | 69,690 | 71,361 | 75,738 | ||||||||||||||||
| Switzerland | USD | 34,238 | 34,138 | 33,055 | 34,580 | 36,788 | ||||||||||||||||
| USA | USD | 62,870 | 66,431 | 70,301 | 74,097 | 78,084 | ||||||||||||||||
| United Kingdom | USD | 36,086 | 38,314 | 37,566 | 38,529 | 40,340 | ||||||||||||||||
| Venezuela | USD | 2,577 | 157,943 | 72,555,823 | 119,993,679 | 235,347,000,000 | ... |
 Helgi Library


