Follow us for the latest automotive news.
Hyundai Motor Company stock traded at KRW 120,500 per share at the end 2019 translating into a market capitalization of USD 21,060 mil. Since the end of 2014, the stock has depreciated by 17.4% representing an annual average growth of -3.76%.
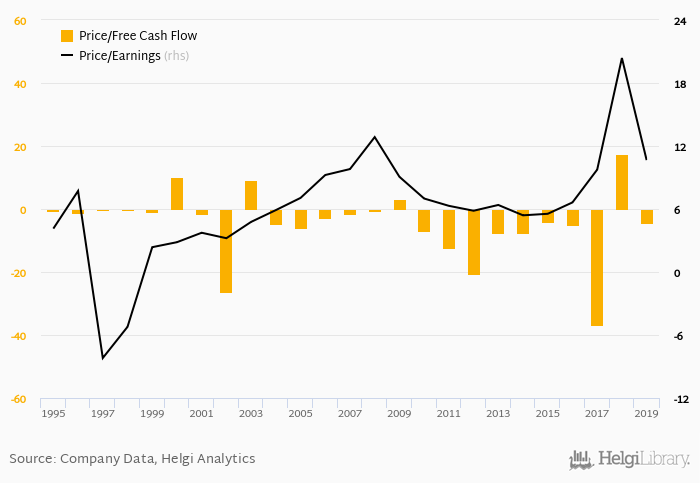
At the end of 2019, the firm traded at price to earnings of 10.7x. Over the last five years, this multiple achieved a high of 20.4x in 2018 and a low of 5.54x in 2015 with an average of 10.6x.
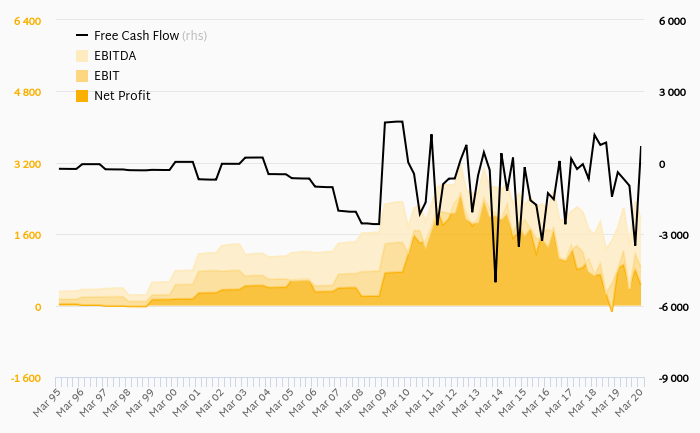
Regarding cash generated defined by the sum of net profit and depreciation, the stock traded at 4.29x at the end of 2019. When investments are excluded to get free cash flow, Hyundai Motor Company traded at -4.43x.
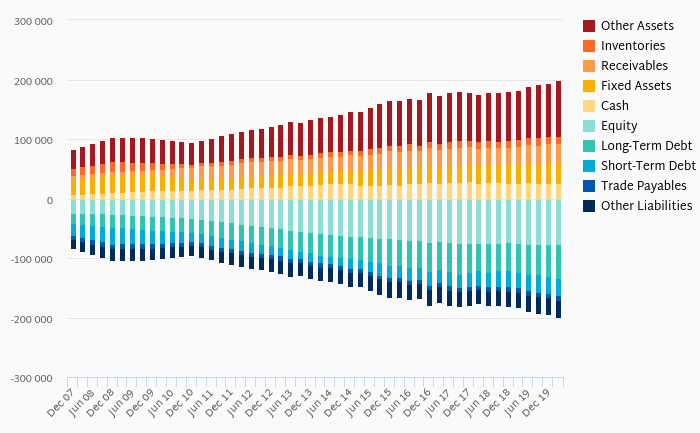
At the end of 2019, the company had a net debt of KRW 56,766 bil, or 8.98x of EBITDA and 74.3% of equity. The firm generated an average return on equity of 4.49% for its shareholders in the last five years and an average dividend yield of 3.11%.
You can see all the company’s data at Hyundai Motor Company profile, or you can download a report on the company in the report section.
 Helgi Library