
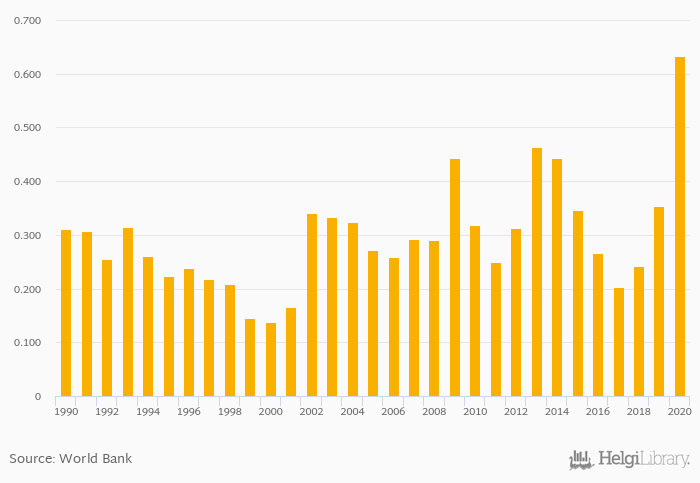
Imports as a share of GDP rose 79.0% to 0.633% in Libya in 2020, according to the National Statistical Office.
Historically, imports as a share of GDP in Libya reached an all time high of 0.633% in 2020 and an all time low of 0.137% in 2000. When compared to Libya's main peers, imports as a share of GDP in Algeria amounted to 0.280%, 0.420% in Chad, 0.207% in Egypt and 0.463% in Tunisia in 2020.
Libya has been ranked 26th within the group of 163 countries we follow in terms of imports as a share of GDP, 90 places above the position seen 10 years ago.
| Imports (As % of GDP) | Unit | 2001 | 2002 | 2003 | 2004 | 2005 | 2006 | 2007 | 2008 | 2009 | 2010 | 2011 | 2012 | 2013 | 2014 | 2015 | 2016 | 2017 | 2018 | 2019 | 2020 | 2021 |
| Algeria | % | 0.365% | 0.351% | 0.327% | 0.322% | 0.291% | ||||||||||||||||
| Cameroon | % | 0.246% | 0.217% | 0.208% | 0.219% | 0.235% | ||||||||||||||||
| Chad | % | 0.366% | 0.370% | 0.397% | 0.380% | 0.378% | ||||||||||||||||
| Egypt | % | 0.217% | 0.199% | 0.293% | 0.294% | 0.257% | ||||||||||||||||
| Israel | % | 0.280% | 0.281% | 0.273% | 0.290% | 0.270% | ||||||||||||||||
| Italy | % | 0.267% | 0.260% | 0.279% | 0.289% | 0.283% | ||||||||||||||||
| Libya | % | 0.347% | 0.265% | 0.204% | 0.242% | 0.354% | ... | |||||||||||||||
| Malta | % | 1.45% | 1.45% | 1.36% | 1.28% | 1.29% | ||||||||||||||||
| Morocco | % | 0.373% | 0.404% | 0.416% | 0.434% | 0.419% | ||||||||||||||||
| Niger | % | 0.305% | 0.243% | 0.263% | 0.263% | 0.263% | ||||||||||||||||
| Nigeria | % | 0.107% | 0.115% | 0.132% | 0.175% | 0.198% | ||||||||||||||||
| Saudi Arabia | % | 0.378% | 0.307% | 0.293% | 0.257% | 0.272% | ||||||||||||||||
| Spain | % | 0.306% | 0.299% | 0.315% | 0.324% | 0.320% | ||||||||||||||||
| Sudan | % | 0.008% | 0.007% | 0.008% | 0.007% | 0.006% | ||||||||||||||||
| Tunisia | % | 0.488% | 0.488% | 0.541% | 0.584% | 0.564% |
 Helgi Library


