
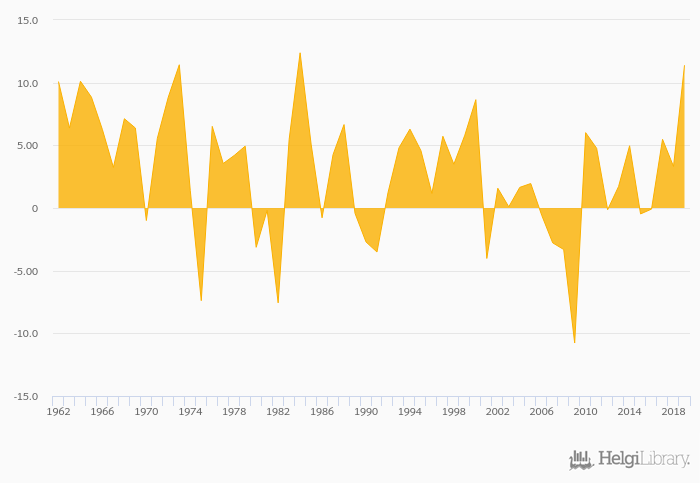
Industrial production growth rose 244% to 11.4% in Canada in 2019, according to the National Statistical Office.
Historically, industrial production growth in Canada reached an all time high of 12.4% in 1984 and an all time low of -10.8% in 2009. When compared to Canada's main peers, industrial production growth in Australia amounted to 4.84%, -1.45% in Mexico, 0.057% in United Kingdom and 0.804% in USA in 2019.
Canada has been ranked 1st within the group of 53 countries we follow in terms of industrial production growth, 51 places above the position seen 10 years ago.
| Industrial Production Growth | Unit | 2000 | 2001 | 2002 | 2003 | 2004 | 2005 | 2006 | 2007 | 2008 | 2009 | 2010 | 2011 | 2012 | 2013 | 2014 | 2015 | 2016 | 2017 | 2018 | 2019 | 2020 |
| Australia | % | 1.36% | -0.662% | 4.47% | 2.65% | 1.36% | ||||||||||||||||
| Belgium | % | 1.36% | -0.662% | 4.47% | 2.65% | 1.36% | ||||||||||||||||
| Belize | % | ... | ... | ... | ... | ... | ... | ... | ... | ... | ... | ... | ... | ... | ... | ... | ... | ... | ... | ... | ... | ... |
| Canada | % | 4.97% | -0.474% | -0.087% | 5.48% | 3.31% | ... | |||||||||||||||
| China | % | ... | ... | ... | ... | ... | ... | ... | ... | ... | ... | ... | 8.26% | 6.10% | 6.07% | 6.68% | ... | ... | ... | |||
| France | % | -1.12% | 1.66% | 0.502% | 1.99% | 0.705% | ||||||||||||||||
| Germany | % | 1.35% | 1.45% | 1.32% | 2.71% | 0.961% | ||||||||||||||||
| Guatemala | % | ... | ... | ... | ... | ... | ... | ... | ... | ... | ... | ... | ... | ... | ... | ... | ... | ... | ... | ... | ... | ... |
| Honduras | % | ... | ... | ... | ... | ... | ... | ... | ... | ... | ... | ... | ... | ... | ... | ... | ... | ... | ... | ... | ... | ... |
| Indonesia | % | ... | ... | ... | ... | ... | ... | ... | ... | ... | ... | ... | ... | ... | ... | ... | ... | ... | ... | ... | ... | ... |
| Ireland | % | 20.9% | 36.9% | 1.79% | -2.24% | -0.134% | ... | ... | ||||||||||||||
| Japan | % | 1.89% | -1.30% | -0.299% | 4.23% | ... | ... | ... | ||||||||||||||
| Malaysia | % | 5.18% | 4.72% | 4.12% | 4.45% | 3.01% | ... | ... | ||||||||||||||
| Mexico | % | 2.86% | 4.18% | -12.1% | 4.67% | 14.7% | ... | |||||||||||||||
| New Zealand | % | 2.50% | 1.33% | 1.92% | 1.97% | ... | ... | ... | ||||||||||||||
| Papua New Guinea | % | ... | ... | ... | ... | ... | ... | ... | ... | ... | ... | ... | ... | ... | ... | ... | ... | ... | ... | ... | ... | ... |
| USA | % | 3.07% | -0.995% | -1.96% | 2.32% | 3.94% | ... | |||||||||||||||
| United Kingdom | % | 1.48% | 0.334% | 0.959% | 1.08% | 1.03% | ... |
 Helgi Library


