
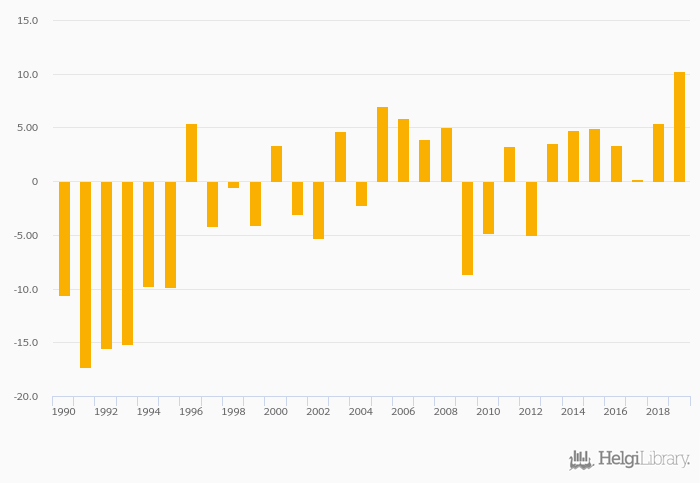
Industrial production growth rose 90.1% to 10.2% in Macedonia in 2019, according to the National Statistical Office.
Historically, industrial production growth in Macedonia reached an all time high of 10.2% in 2019 and an all time low of -17.3% in 1991.
Macedonia has been ranked 2nd within the group of 53 countries we follow in terms of industrial production growth, 43 places above the position seen 10 years ago.
| Industrial Production Growth | Unit | 2000 | 2001 | 2002 | 2003 | 2004 | 2005 | 2006 | 2007 | 2008 | 2009 | 2010 | 2011 | 2012 | 2013 | 2014 | 2015 | 2016 | 2017 | 2018 | 2019 | 2020 |
| Albania | % | 2.86% | 4.18% | -12.1% | 4.67% | 14.7% | ||||||||||||||||
| Bulgaria | % | 1.84% | 2.87% | 2.65% | 3.45% | 0.335% | ||||||||||||||||
| Greece | % | -5.97% | -0.382% | -7.37% | 8.61% | 1.69% | ||||||||||||||||
| Kosovo | % | ... | ... | ... | ... | ... | ... | ... | ... | ... | ... | ... | ... | ... | ... | ... | ... | ... | ... | ... | ... | ... |
| Macedonia | % | 4.79% | 4.91% | 3.37% | 0.202% | 5.38% | ... | |||||||||||||||
| Montenegro | % | -11.4% | 7.89% | -2.94% | -4.22% | 22.4% | ... | |||||||||||||||
| Romania | % | 5.90% | 6.12% | 3.40% | 9.07% | 1.09% | ||||||||||||||||
| Serbia | % | -7.35% | 7.31% | 5.22% | 3.87% | 1.27% | ||||||||||||||||
| Turkey | % | 5.90% | 6.12% | 3.40% | 9.07% | 1.09% |
 Helgi Library


