
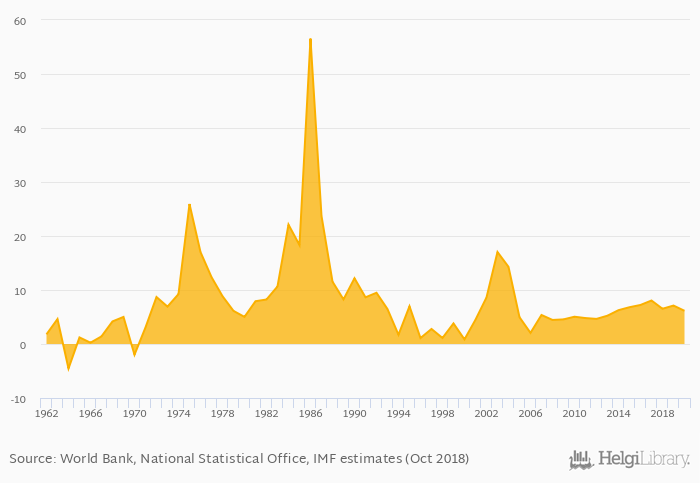
Average inflation measured by CPI fell 13.6% to 6.15% in Gambia in 2020, according to the National Statistical Office.
Historically, average inflation measured by CPI in Gambia reached an all time high of 56.6% in 1986 and an all time low of -4.54% in 1964. When compared to Gambia's main peers, average inflation measured by CPI in Guinea Bissau amounted to 2.03%, 0.499% in Mali, 3.85% in Mauritania and 1.99% in Senegal in 2020.
Gambia has been ranked 35th within the group of 172 countries we follow in terms of average inflation measured by CPI, 27 places above the position seen 10 years ago.
| Inflation, CPI (Average) | Unit | 2007 | 2008 | 2009 | 2010 | 2011 | 2012 | 2013 | 2014 | 2015 | 2016 | 2017 | 2018 | 2019 | 2020 | 2021 | 2022 | 2023 | 2024 | 2025 | 2026 | 2027 |
| Algeria | % | 7.23% | 9.74% | 8.68% | 9.30% | 10.4% | ||||||||||||||||
| Burkina Faso | % | 3.86% | 14.2% | 1.50% | 1.00% | 2.00% | ||||||||||||||||
| Gambia | % | 7.37% | 11.3% | 11.1% | 8.41% | 6.05% | ||||||||||||||||
| Guinea | % | 12.6% | 12.7% | 12.2% | 10.3% | 8.88% | ||||||||||||||||
| Guinea Bissau | % | 3.27% | 5.52% | 4.00% | 3.00% | 2.00% | ||||||||||||||||
| Mali | % | 3.81% | 8.00% | 3.00% | 2.50% | 2.00% | ||||||||||||||||
| Mauritania | % | 3.77% | 7.10% | 7.75% | 5.75% | 5.75% | ||||||||||||||||
| Morocco | % | 1.40% | 6.20% | 4.10% | 2.19% | 2.00% | ||||||||||||||||
| Niger | % | 3.84% | 4.51% | 3.00% | 2.50% | 2.00% | ||||||||||||||||
| Senegal | % | 2.18% | 7.50% | 3.10% | 2.00% | 2.00% |
 Helgi Library


