
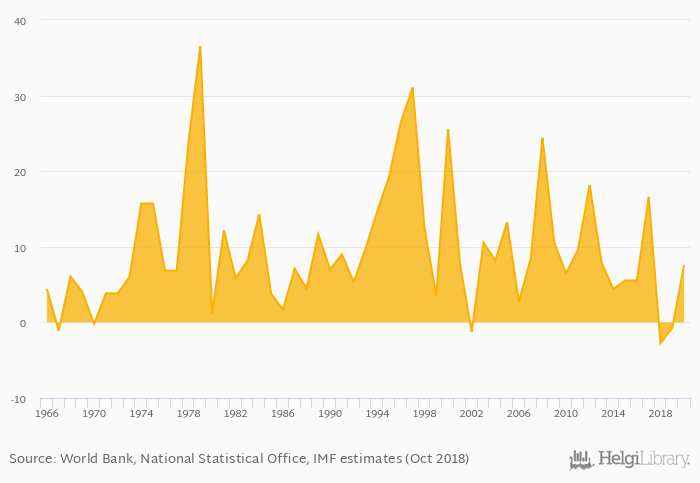
Average inflation measured by CPI rose 1.00% to 7.56% in Burundi in 2020, according to the National Statistical Office.
Historically, average inflation measured by CPI in Burundi reached an all time high of 36.5% in 1979 and an all time low of -2.77% in 2018. When compared to Burundi's main peers, average inflation measured by CPI in Rwanda amounted to 6.90%, 3.56% in Tanzania, 4.18% in Uganda and 11.5% in Dem. Republic of the Congo in 2020.
Burundi has been ranked 29th within the group of 172 countries we follow in terms of average inflation measured by CPI, 14 places above the position seen 10 years ago.
| Inflation, CPI (Average) | Unit | 2007 | 2008 | 2009 | 2010 | 2011 | 2012 | 2013 | 2014 | 2015 | 2016 | 2017 | 2018 | 2019 | 2020 | 2021 | 2022 | 2023 | 2024 | 2025 | 2026 | 2027 |
| Angola | % | 25.8% | 21.7% | 11.8% | 9.90% | 7.90% | ||||||||||||||||
| Burundi | % | 8.31% | 17.3% | 8.50% | 4.50% | 4.20% | ||||||||||||||||
| Central African Republic | % | 4.26% | 6.53% | 6.30% | 2.70% | 2.78% | ||||||||||||||||
| Congo | % | 1.97% | 3.50% | 3.20% | 3.00% | 3.00% | ||||||||||||||||
| Dem. Republic of the Congo | % | 8.99% | 8.44% | 9.80% | 5.62% | 5.92% | ||||||||||||||||
| Kenya | % | 6.11% | 7.38% | 6.64% | 5.13% | 5.07% | ||||||||||||||||
| Mozambique | % | 5.69% | 11.3% | 8.59% | 8.16% | 6.65% | ||||||||||||||||
| Rwanda | % | 0.818% | 9.50% | 8.00% | 5.00% | 5.00% | ||||||||||||||||
| South Sudan | % | 30.2% | 17.6% | 21.7% | 12.0% | 8.50% | ||||||||||||||||
| Tanzania | % | 3.69% | 3.96% | 5.33% | 4.47% | 3.95% | ||||||||||||||||
| Uganda | % | 2.21% | 6.44% | 6.40% | 5.71% | 4.99% | ||||||||||||||||
| Zambia | % | 22.0% | 12.5% | 9.55% | 7.65% | 7.15% |
 Helgi Library


