
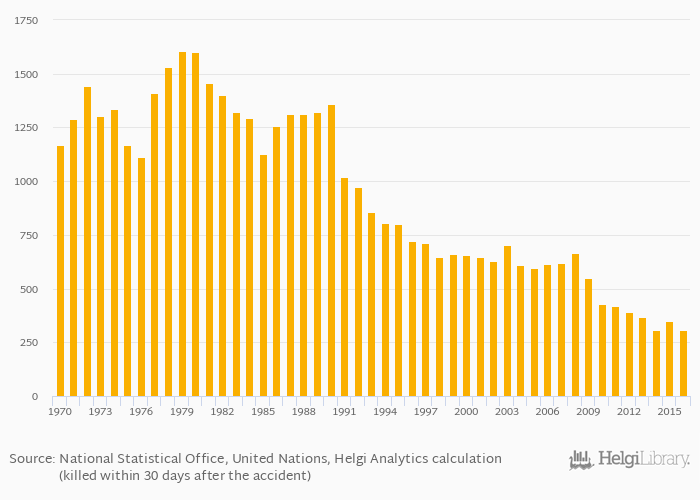
Killed in road traffic accidents fell 11.8% to 307 persons in Croatia in 2016, according to the National Statistical Office.
Historically, killed in road traffic accidents in Croatia reached an all time high of 1,605 persons in 1979 and an all time low of 307 persons in 2016.
Croatia has been ranked 26th within the group of 39 countries we follow in terms of killed in road traffic accidents, 11 places above the position seen 10 years ago.
| Killed In Road Traffic Accidents | Unit | 1996 | 1997 | 1998 | 1999 | 2000 | 2001 | 2002 | 2003 | 2004 | 2005 | 2006 | 2007 | 2008 | 2009 | 2010 | 2011 | 2012 | 2013 | 2014 | 2015 | 2016 |
| Albania | persons | 353 | 322 | 334 | 295 | 264 | ... | |||||||||||||||
| Austria | persons | 552 | 523 | 531 | 455 | 430 | ||||||||||||||||
| Bosnia and Herzegovina | persons | ... | 356 | 303 | 334 | ... | ... | ... | ||||||||||||||
| Croatia | persons | 426 | 418 | 393 | 368 | 308 | ||||||||||||||||
| Hungary | persons | 740 | 638 | 605 | 591 | 626 | ||||||||||||||||
| Italy | persons | 4,114 | 3,860 | 3,753 | 3,401 | 3,381 | ||||||||||||||||
| Montenegro | persons | ... | ... | ... | ... | ... | ... | ... | ... | ... | ... | 95.0 | 58.0 | 46.0 | 74.0 | 65.0 | ||||||
| Romania | persons | 2,377 | 2,018 | 2,042 | 1,861 | 1,818 | ||||||||||||||||
| Serbia | persons | ... | ... | 656 | 728 | 684 | 646 | 536 | ||||||||||||||
| Slovenia | persons | 138 | 141 | 130 | 125 | 108 |
 Helgi Library


