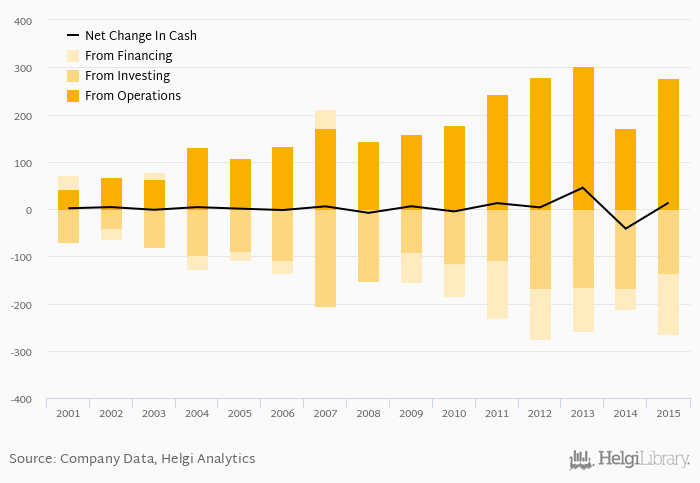
Krka's operating cash flow stood at EUR 278 mil in 2015, up 62.7% when compared to the previous year. Historically, between 2001 - 2015, the firm’s operating cash flow reached a high of EUR 303 mil in 2013 and a low of EUR 41.6 mil in 2001.
Krka's total investments stood at EUR -135 mil and accounted for 9.35% of sales in 2015. This is compared to an average of 11.9% as seen over the last five years.
Cash from financing amounted to EUR -129 mil, so the company generated EUR 13.3 mil net cash in 2015.
At the end of 2015, the company had a net debt of EUR -35.8 mil, or -0.117x of EBITDA and -0.025 of equity. Net working capital amounted to EUR 602 mil, or 51.7% of sales. Cash conversion cycle is negative and reached 262 days days in 2015. This means Krka generates revenue from customers before it has to pay its suppliers for inventory, among other things.
You can see all the company’s data at Krka profile, or you can download a report on the company in the report section.
 Helgi Library