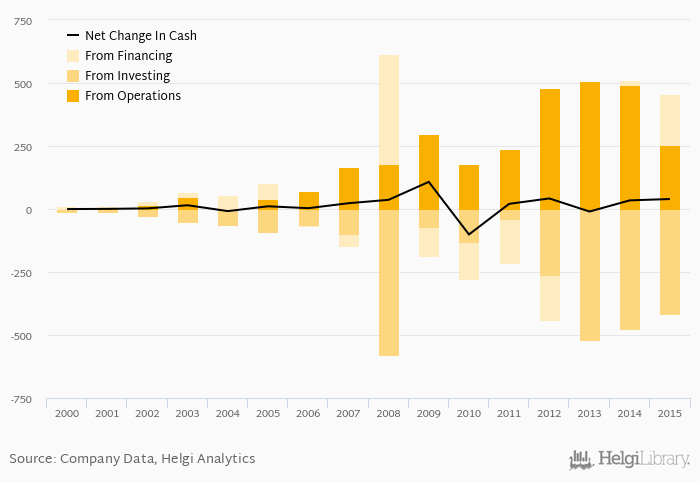
LPP's operating cash flow stood at PLN 254 mil in 2015, down 48.5% when compared to the previous year. Historically, between 2000 - 2015, the firm’s operating cash flow reached a high of PLN 509 mil in 2013 and a low of PLN -0.759 mil in 2004.
LPP's total investments stood at PLN -416 mil and accounted for 9.56% of sales in 2015. This is compared to an average of 9.68% as seen over the last five years.
Cash from financing amounted to PLN 201 mil, so the company generated PLN 39.5 mil net cash in 2015.
At the end of 2015, the company had a net debt of PLN 621 mil, or 0.855x of EBITDA and 0.329 of equity. Net working capital amounted to PLN 713 mil, or 13.9% of sales. Cash conversion cycle is negative and reached 128 days days in 2015. This means LPP generates revenue from customers before it has to pay its suppliers for inventory, among other things.
You can see all the company’s data at LPP profile, or you can download a report on the company in the report section.
 Helgi Library