
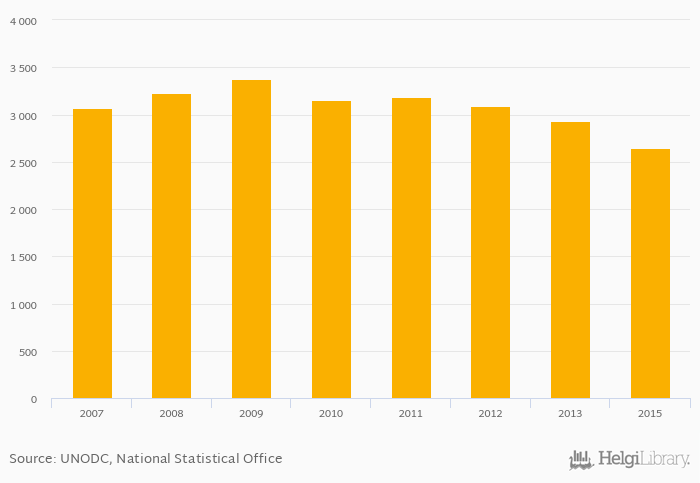
Male adults held in prisons, penal or correctional institutions rose 0% to 2,646 persons in Estonia in 2015, according to the United Nations.
Historically, male adults held in prisons, penal or correctional institutions in Estonia reached an all time high of 3,371 persons in 2009 and an all time low of 2,646 persons in 2015. When compared to Estonia's main peers, male adults held in prisons, penal or correctional institutions in Finland amounted to 2,818 persons, 4,012 persons in Latvia, 6,975 persons in Lithuania and 590,321 persons in Russia in 2015.
Estonia has been ranked 56th within the group of 66 countries we follow in terms of male adults held in prisons, penal or correctional institutions, 56 places below the position seen 10 years ago.
| Male Adults Held in Prisons, Penal or Correctional Institutions | Unit | 1995 | 1996 | 1997 | 1998 | 1999 | 2000 | 2001 | 2002 | 2003 | 2004 | 2005 | 2006 | 2007 | 2008 | 2009 | 2010 | 2011 | 2012 | 2013 | 2014 | 2015 |
| Australia | persons | ... | ... | ... | ... | ... | ... | ... | ... | ... | 27,192 | 27,472 | 27,078 | 27,182 | 28,426 | |||||||
| Belarus | persons | ... | ... | ... | ... | ... | ... | ... | ... | 37,016 | 36,465 | 33,865 | 26,827 | 26,409 | ... | |||||||
| China | persons | ... | ... | ... | ... | ... | ... | ... | ... | ... | ... | ... | ... | ... | ... | ... | ... | ... | 1,547,059 | ... | ... | |
| Estonia | persons | ... | ... | ... | ... | ... | ... | ... | ... | ... | ... | ... | ... | 3,371 | 3,157 | 3,190 | 3,088 | 2,936 | ... | |||
| Finland | persons | ... | ... | ... | ... | ... | ... | ... | ... | 3,249 | 3,046 | 2,969 | 3,000 | 2,960 | ||||||||
| Germany | persons | ... | ... | ... | ... | ... | ... | ... | ... | ... | ... | ... | 68,438 | 66,982 | 65,616 | 64,590 | 62,424 | |||||
| Indonesia | persons | ... | ... | ... | ... | ... | ... | ... | ... | ... | ... | ... | ... | ... | ... | ... | ... | ... | 144,379 | 146,898 | ||
| Japan | persons | ... | ... | ... | ... | ... | ... | ... | ... | ... | 70,001 | 67,615 | 64,510 | 61,710 | 57,890 | ... | ||||||
| Latvia | persons | ... | ... | ... | ... | ... | ... | ... | ... | ... | 6,504 | 6,271 | 6,077 | 5,646 | 4,743 | |||||||
| Lithuania | persons | ... | ... | ... | ... | ... | ... | ... | ... | ... | 8,100 | 8,567 | 9,373 | 9,182 | 8,744 | |||||||
| New Zealand | persons | ... | ... | ... | ... | ... | ... | ... | ... | ... | ... | 7,679 | 7,927 | 7,876 | 7,918 | 7,746 | ||||||
| Papua New Guinea | persons | ... | ... | ... | ... | ... | ... | ... | ... | ... | ... | ... | ... | ... | ... | ... | ... | ... | ... | ... | ... | ... |
| Russia | persons | ... | ... | ... | ... | ... | ... | ... | ... | ... | ... | ... | ... | ... | ... | ... | 745,717 | 689,441 | 640,265 | 618,175 | ||
| USA | persons | ... | ... | ... | ... | ... | ... | ... | ... | ... | 2,081,800 | 2,071,800 | 2,048,200 | 2,033,200 | 2,017,700 |
 Helgi Library


