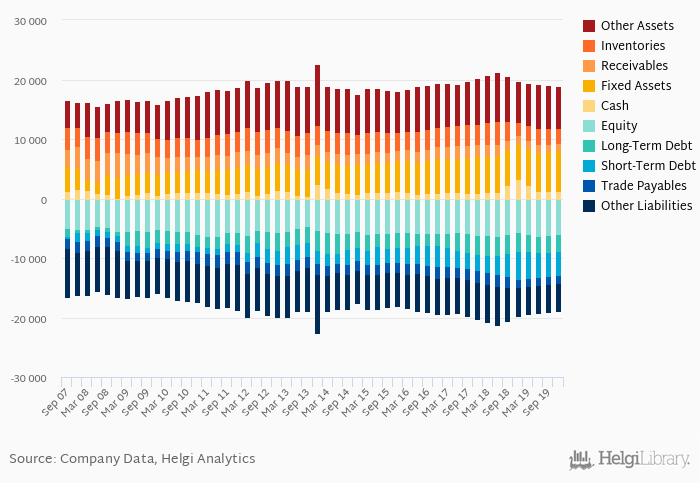
MAN SE's total assets reached EUR 17,691 mil at the end of 2Q2020, down 7.88% compared to the previous year.
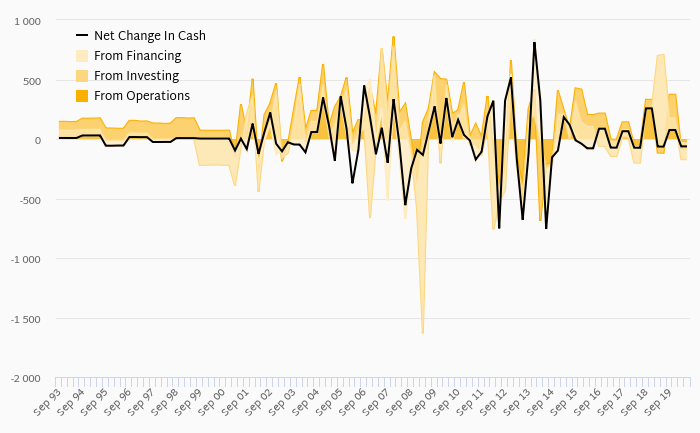
Current assets amounted to EUR 5,181 mil, or 29.3% of total assets while cash stood at EUR 1,220 mil at the end of 2Q2020.
By contrast, total debt reached EUR 7,400 mil at the year-end, or 41.8% of total assets, while the firm's equity amounted to EUR 5,280 mil. As a result, net debt stood at EUR 6,180 mil at the end of 2Q2020 and accounted for 117% of equity.
Net debt against equity is up 45.8 pp from five years ago (71.3%). The ratio against EBITDA increased from 3.52x seen in 2Q2015 to 6.70x.
The company’s cost of funding amounted to 1.43% in 2Q2020, down 1.08 pp compared to the average over the last 5 years.
You can see all the company’s data at MAN SE profile, or you can download a report on the company in the report section.
Cash & Cash Equivalents | Unit | Mar 2008 | Jun 2008 | Sep 2008 | Dec 2008 | Mar 2009 | Jun 2009 | Sep 2009 | Dec 2009 | Mar 2010 | Jun 2010 | Sep 2010 | Dec 2010 | Mar 2011 | Jun 2011 | Sep 2011 | Dec 2011 | Mar 2012 | Jun 2012 | Sep 2012 | Dec 2012 | Mar 2013 | Jun 2013 | Sep 2013 | Dec 2013 | Mar 2014 | Jun 2014 | Sep 2014 | Dec 2014 | Mar 2015 | Jun 2015 | Sep 2015 | Dec 2015 | Mar 2016 | Jun 2016 | Sep 2016 | Dec 2016 | Mar 2017 | Jun 2017 | Sep 2017 | Dec 2017 | Mar 2018 | Jun 2018 | Sep 2018 | Dec 2018 | Mar 2019 | Jun 2019 | Sep 2019 | Dec 2019 | Mar 2020 | Jun 2020 |
Audi Group | EUR mil | 16,623 | 17,194 | 17,771 | 18,087 | 18,402 | ... | ... | |||||||||||||||||||||||||||||||||||||||||||
BMW Group | EUR mil | 17,654 | 18,867 | 17,095 | 19,157 | 17,991 | ... | ||||||||||||||||||||||||||||||||||||||||||||
Daimler Group | EUR mil | 27,063 | 28,863 | 24,727 | 28,594 | 29,312 | ... | ||||||||||||||||||||||||||||||||||||||||||||
MAN SE | EUR mil | 3,323 | 2,271 | 1,208 | 1,249 | 1,290 | |||||||||||||||||||||||||||||||||||||||||||||
Porsche AG | EUR mil | ... | ... | ... | ... | ... | ... | ... | ... | ... | ... | ... | ... | ... | ... | ... | 5,224 | 5,508 | 5,796 | 6,086 | 6,377 | ... | ... | ||||||||||||||||||||||||||||
Volkswagen Group | EUR mil | 55,557 | 38,452 | 28,642 | 35,098 | 53,286 | |||||||||||||||||||||||||||||||||||||||||||||
AVERAGE | EUR mil | 10,146 | 8,863 | 8,516 | 8,272 | 11,211 | 12,937 | 12,867 | 11,809 | 11,772 | 11,105 | 12,746 | 12,314 | 12,057 | 11,312 | 12,401 | 10,118 | 11,090 | 10,867 | 11,350 | 11,847 | 12,698 | 12,499 | 13,741 | 13,806 | 14,261 | 12,034 | 13,173 | 12,817 | 13,808 | 13,286 | 14,989 | 14,925 | 18,053 | 17,843 | 17,634 | 17,960 | 15,867 | 16,812 | 17,914 | 18,067 | 17,397 | 15,654 | 18,282 | 20,907 | 18,526 | 15,873 | 18,045 | 21,110 | 23,282 | 31,284 |