
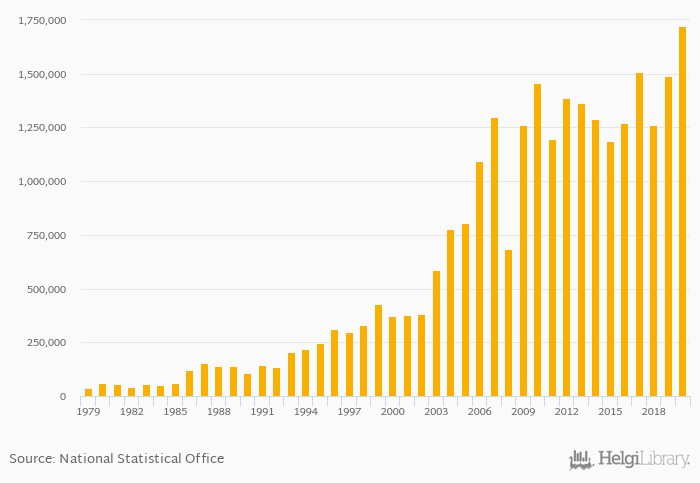
Market capitalisation of listed companies rose 15.7% to USD 1,720,556 bil in Australia in 2020, according to OECD.
Historically, market capitalisation of listed companies in Australia reached an all time high of USD 1,720,556 bil in 2020 and an all time low of USD 38,945 bil in 1979.
Australia has been ranked 12th within the group of 67 countries we follow in terms of market capitalisation of listed companies, 2 places below the position seen 10 years ago.
| Market Capitalisation of Listed Companies (USD) | Unit | 2000 | 2001 | 2002 | 2003 | 2004 | 2005 | 2006 | 2007 | 2008 | 2009 | 2010 | 2011 | 2012 | 2013 | 2014 | 2015 | 2016 | 2017 | 2018 | 2019 | 2020 |
| Australia | USD bil | 1,288,708 | 1,187,083 | 1,268,494 | 1,508,463 | 1,262,800 | ||||||||||||||||
| Cambodia | USD bil | ... | ... | ... | ... | ... | ... | ... | ... | ... | ... | ... | ... | ... | ... | ... | ... | ... | ... | ... | ... | ... |
| Indonesia | USD bil | 422,127 | 353,271 | 425,768 | 520,687 | 486,766 | ||||||||||||||||
| Malaysia | USD bil | 459,004 | 382,977 | 359,788 | 455,772 | 398,019 | ||||||||||||||||
| New Zealand | USD bil | 74,416 | 74,351 | 80,048 | 94,691 | 86,133 | ||||||||||||||||
| Papua New Guinea | USD bil | ... | 3,311 | 1,719 | 1,643 | 1,682 | ... | ... | ... | |||||||||||||
| Philippines | USD bil | 261,841 | 238,820 | 239,738 | 290,401 | 258,156 | ||||||||||||||||
| Singapore | USD bil | 752,831 | 639,956 | 640,428 | 787,255 | 687,257 | ||||||||||||||||
| Thailand | USD bil | 430,427 | 348,798 | 432,956 | 548,795 | 500,741 | ||||||||||||||||
| Vietnam | USD bil | ... | ... | ... | 52,427 | 58,734 | 73,222 | 125,310 | 132,653 |
 Helgi Library


