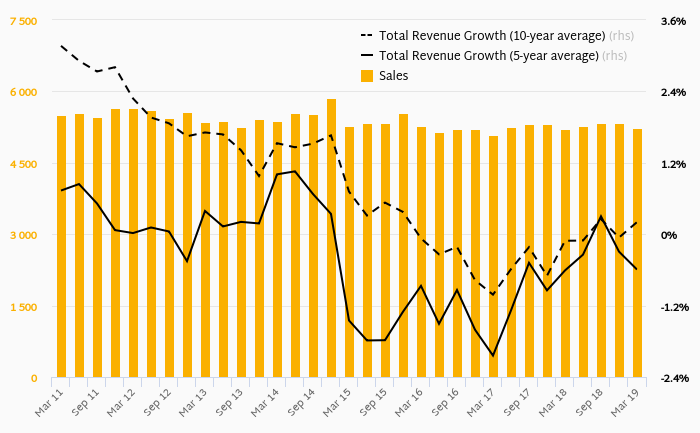
McKesson Europe's total assets reached EUR 7,091 mil at the end of 1Q2019, up 2.79% compared to the previous year.
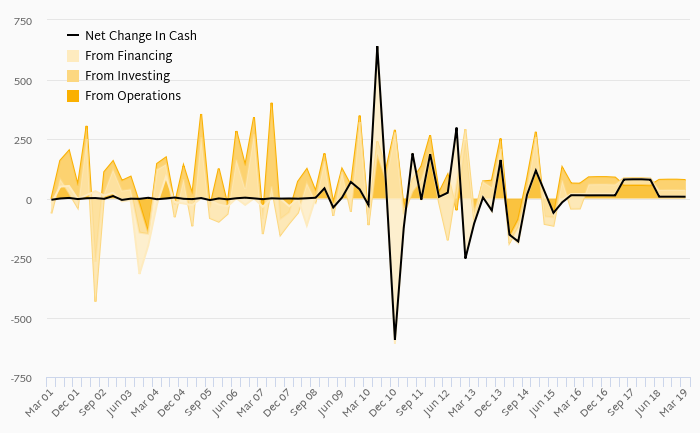
Current assets amounted to EUR 5,332 mil, or 75.2% of total assets while cash stood at EUR 827 mil at the end of 1Q2019.
By contrast, total debt reached EUR 986 mil at the year-end, or 13.9% of total assets, while the firm's equity amounted to EUR 1,984 mil. As a result, net debt stood at EUR 160 mil at the end of 1Q2019 and accounted for 8.05% of equity.
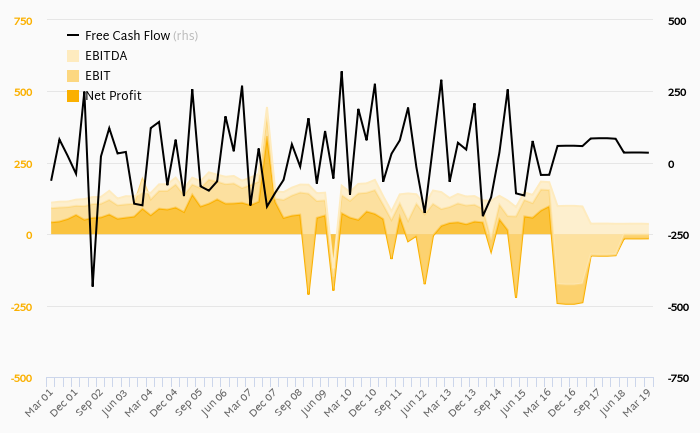
Net debt against equity is down 24.4 pp from five years ago (32.5%). The ratio against EBITDA decreased from 1.78x seen in 1Q2014 to 1.09x.
The company’s cost of funding amounted to 4.33% in 1Q2019, down 0.526 pp compared to the average over the last 5 years.
You can see all the company’s data at McKesson Europe profile, or you can download a report on the company in the report section.
Cash & Cash Equivalents | Unit | Dec 2006 | Mar 2007 | Jun 2007 | Sep 2007 | Dec 2007 | Mar 2008 | Jun 2008 | Sep 2008 | Dec 2008 | Mar 2009 | Jun 2009 | Sep 2009 | Dec 2009 | Mar 2010 | Jun 2010 | Sep 2010 | Dec 2010 | Mar 2011 | Jun 2011 | Sep 2011 | Dec 2011 | Mar 2012 | Jun 2012 | Sep 2012 | Dec 2012 | Mar 2013 | Jun 2013 | Sep 2013 | Dec 2013 | Mar 2014 | Jun 2014 | Sep 2014 | Dec 2014 | Mar 2015 | Jun 2015 | Sep 2015 | Dec 2015 | Mar 2016 | Jun 2016 | Sep 2016 | Dec 2016 | Mar 2017 | Jun 2017 | Sep 2017 | Dec 2017 | Mar 2018 | Jun 2018 | Sep 2018 | Dec 2018 | Mar 2019 |
McKesson Europe | EUR mil | ... | ... | ... | ... | ... | ... | ... | ... | ... | 637 | 717 | 796 | 804 | 812 | ||||||||||||||||||||||||||||||||||||
AVERAGE | EUR mil | ... | ... | ... | ... | ... | ... | ... | ... | ... | 15.6 | 19.8 | 89.2 | 128 | 100 | 95.0 | 105 | 201 | 77.4 | 268 | 309 | 448 | 429 | 455 | 165 | 524 | 420 | 536 | 374 | 536 | 384 | 203 | 218 | 336 | 372 | 312 | 295 | 411 | 424 | 437 | 370 | 463 | 476 | 556 | 637 | 717 | 796 | 804 | 812 | 819 | 827 |