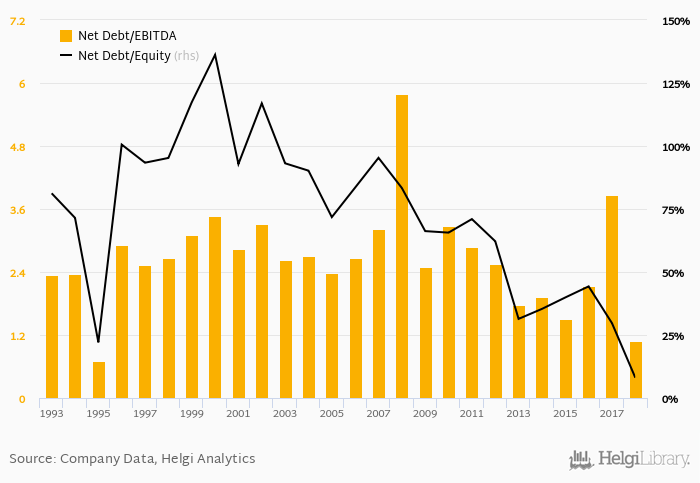
McKesson Europe's net debt stood at EUR 160 mil and accounted for 8.05% of equity at the end of 2018. The ratio is down 21.7 pp compared to the previous year.
Historically, the firm’s net debt to equity reached a high of 136% in 2000 and a low of 8.05% in 2018 between 1993 and 2018. The average for the last five years was 31.5%.
Net debt to EBITDA was calculated at 1.09x at the end of the year. That is up from 1.78x seen in 2013. The ratio reached a high of 5.78x in 2008 and a low of 0.706x in 1995.
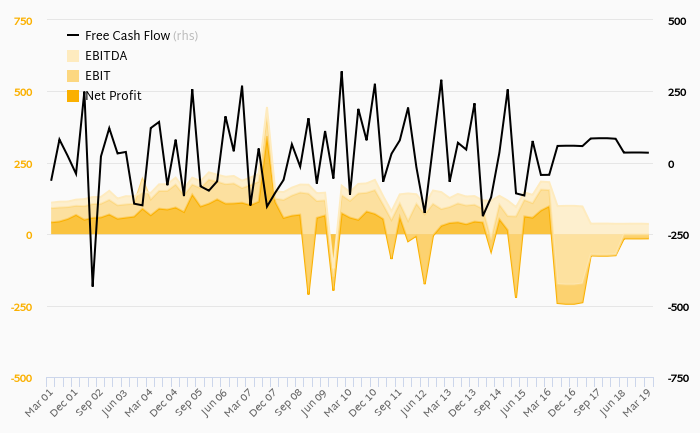
The company’s cost of funding amounted to 3.86% in 2018, down which is above the 5-year of 4.89%. Funding costs have “eaten” some 769% of the operating profit generated in 2019.
You can see all the company’s data at McKesson Europe profile, or you can download a report on the company in the report section.
 Helgi Library