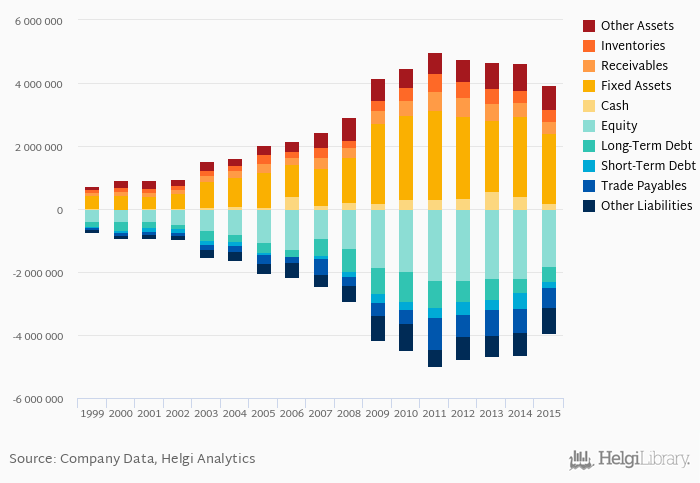
MOL's total assets reached HUF 3,928,000 mil at the end of 2015, down 15.5% compared to the previous year.
Current assets amounted to HUF 1,067,300 mil, or 27.2% of total assets while cash stood at HUF 195,361 mil at the end of 2015.
By contrast, total debt reached HUF 667,662 mil at the year-end, or 17.0% of total assets, while the firm's equity amounted to HUF 1,821,120 mil. As a result, net debt stood at HUF 472,301 mil at the end of 2015 and accounted for 0.259 of equity.
Net debt against equity is down 0.195 pp from five years ago (0.455). The ratio against EBITDA decreased from 1.78x seen in 2010 to 0.729x.
The company’s cost of funding amounted to 10.7% in 2015, up 5.60 pp compared to the average over the last 5 years.
You can see all the company’s data at MOL profile, or you can download a report on the company in the report section.
 Helgi Library