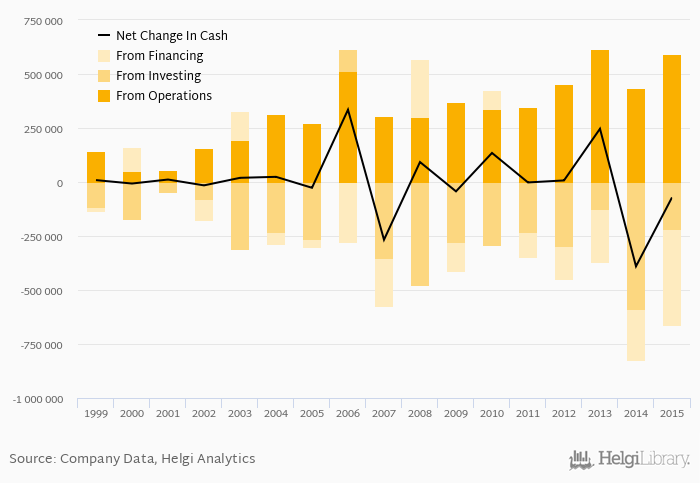
MOL's operating cash flow stood at HUF 592,184 mil in 2015, up 36.3% when compared to the previous year. Historically, between 1999 - 2015, the firm’s operating cash flow reached a high of HUF 614,685 mil in 2013 and a low of HUF 49,376 mil in 2000.
MOL's total investments stood at HUF -218,299 mil and accounted for 9.22% of sales in 2015. This is compared to an average of 6.04% as seen over the last five years.
Cash from financing amounted to HUF -445,414 mil, so the company generated HUF -71,529 mil net cash in 2015.
At the end of 2015, the company had a net debt of HUF 472,301 mil, or 0.729x of EBITDA and 0.259 of equity. Net working capital amounted to HUF 133,121 mil, or 3.24% of sales. Cash conversion cycle is negative and reached 3.97 days days in 2015. This means MOL generates revenue from customers before it has to pay its suppliers for inventory, among other things.
You can see all the company’s data at MOL profile, or you can download a report on the company in the report section.
 Helgi Library