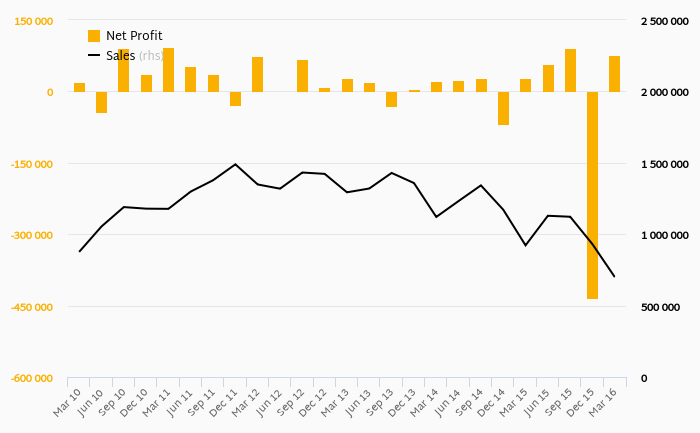
MOL made a net profit of HUF -256,554 mil in 2015, down 6% compared to the previous year. Total sales reached HUF 4,102,580 mil, which is down 15.7% when compared to the previous year.
Historically, between 1999 and 2015, the company’s net profit reached a high of HUF 329,483 mil in 2006 and a low of HUF -256,554 mil in 2015. Over the last decade the firm's net profit increased by an average of 0% a year.
Sales have grown by 5.19% a year on average since 2005. They reached a high of HUF 5,534,810 mil in 2012 and a low of HUF 742,648 mil in 1999.
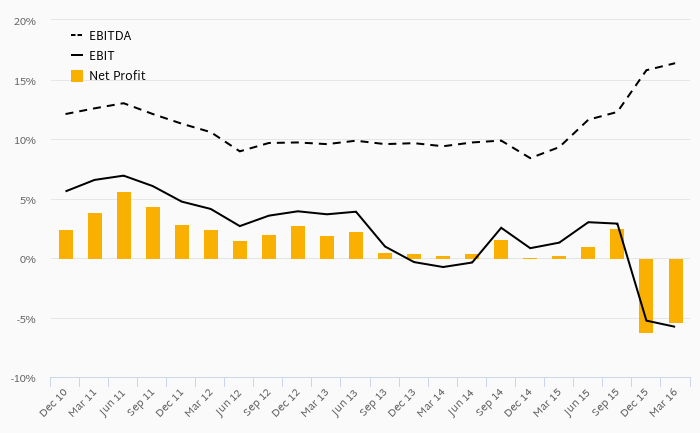
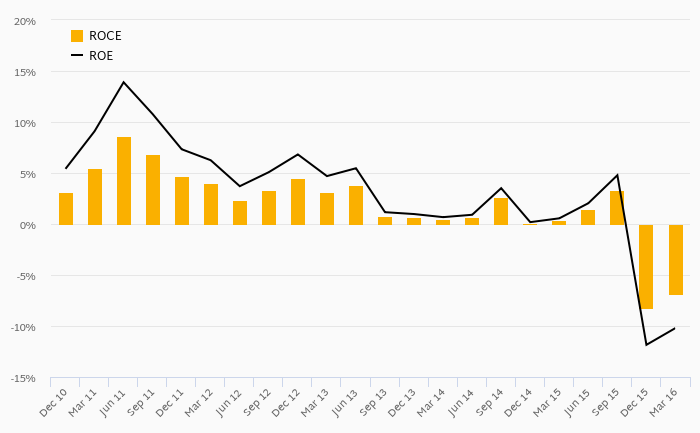
The company has been operating with an average EBITDA margin of 10.9% in the last 5 years and average net margin of -0.030%. The firm generated an average return on invested capital of 0.257% for its shareholders over the last five years.
You can see all the company’s data at MOL profile, or you can download a report on the company in the report section.
 Helgi Library