
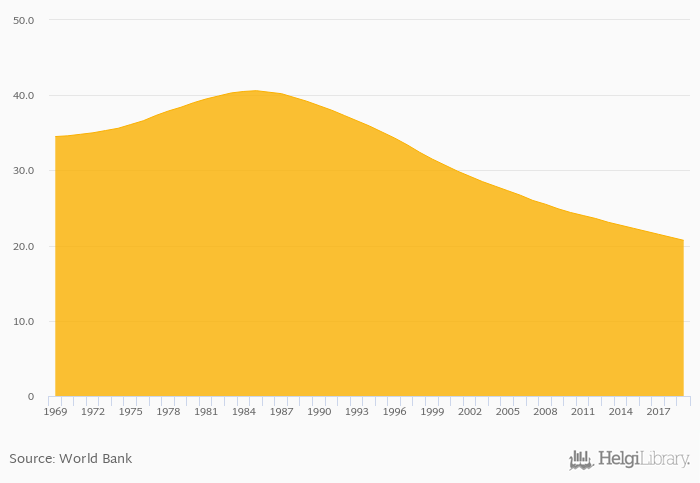
Neonatal mortality per 1,000 live births fell 1.90% to 20.7 in Madagascar in 2019, according to World Bank / WHO.
Historically, neonatal mortality per 1,000 live births in Madagascar reached an all time high of 40.6 in 1985 and an all time low of 20.7 in 2019. When compared to Madagascar's main peers, neonatal mortality per 1,000 live births in Mozambique amounted to 28.9, 10.8 in South Africa, 20.7 in Swaziland and 20.6 in Tanzania in 2019.
Madagascar has been ranked 46th within the group of 172 countries we follow in terms of neonatal mortality per 1,000 live births, 1 place above the position seen 10 years ago.
| Neonatal Mortality (Per 1,000 Live Births) | Unit | 2000 | 2001 | 2002 | 2003 | 2004 | 2005 | 2006 | 2007 | 2008 | 2009 | 2010 | 2011 | 2012 | 2013 | 2014 | 2015 | 2016 | 2017 | 2018 | 2019 | 2020 |
| Botswana | 23.3 | 23.3 | 23.2 | 23.0 | 22.7 | |||||||||||||||||
| Kenya | 22.9 | 22.6 | 22.2 | 21.8 | 21.4 | |||||||||||||||||
| Lesotho | 44.1 | 44.7 | 45.1 | 45.2 | 45.1 | |||||||||||||||||
| Madagascar | 22.7 | 22.3 | 21.9 | 21.5 | 21.1 | |||||||||||||||||
| Malawi | 23.7 | 22.7 | 21.8 | 21.0 | 20.3 | |||||||||||||||||
| Mozambique | 31.8 | 31.3 | 30.7 | 30.1 | 29.5 | |||||||||||||||||
| Namibia | 21.8 | 21.7 | 21.5 | 21.2 | 20.8 | |||||||||||||||||
| South Africa | 11.0 | 11.1 | 11.1 | 11.1 | 11.0 | |||||||||||||||||
| Swaziland | 22.4 | 22.1 | 21.8 | 21.5 | 21.1 | |||||||||||||||||
| Tanzania | 22.8 | 22.3 | 21.9 | 21.5 | 21.0 | |||||||||||||||||
| Uganda | 22.7 | 22.1 | 21.5 | 20.8 | 20.3 | |||||||||||||||||
| Zambia | 25.4 | 25.3 | 25.2 | 25.0 | 24.7 |
 Helgi Library


