
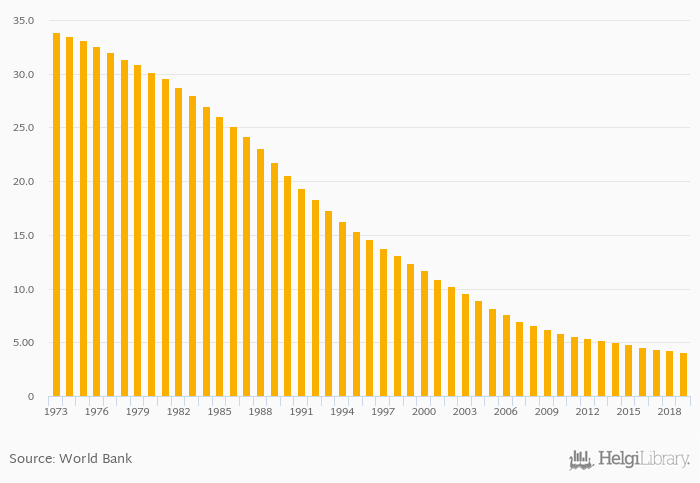
Neonatal mortality per 1,000 live births fell 4.65% to 4.10 in Lebanon in 2019, according to World Bank / WHO.
Historically, neonatal mortality per 1,000 live births in Lebanon reached an all time high of 33.9 in 1973 and an all time low of 4.10 in 2019. When compared to Lebanon's main peers, neonatal mortality per 1,000 live births in Cyprus amounted to 1.70, 1.90 in Israel, 9.10 in Jordan and 10.8 in Syria in 2019.
Lebanon has been ranked 122nd within the group of 172 countries we follow in terms of neonatal mortality per 1,000 live births, 5 places below the position seen 10 years ago.
| Neonatal Mortality (Per 1,000 Live Births) | Unit | 2000 | 2001 | 2002 | 2003 | 2004 | 2005 | 2006 | 2007 | 2008 | 2009 | 2010 | 2011 | 2012 | 2013 | 2014 | 2015 | 2016 | 2017 | 2018 | 2019 | 2020 |
| Cyprus | 1.70 | 1.70 | 1.70 | 1.70 | 1.70 | |||||||||||||||||
| Egypt | 12.8 | 12.3 | 11.9 | 11.5 | 11.1 | |||||||||||||||||
| Greece | 2.60 | 2.60 | 2.60 | 2.60 | 2.50 | |||||||||||||||||
| Iraq | 17.5 | 17.0 | 16.4 | 15.9 | 15.4 | |||||||||||||||||
| Israel | 2.10 | 2.10 | 2.00 | 2.00 | 2.00 | |||||||||||||||||
| Jordan | 10.6 | 10.2 | 10.0 | 9.70 | 9.40 | |||||||||||||||||
| Lebanon | 5.00 | 4.80 | 4.60 | 4.40 | 4.30 | |||||||||||||||||
| Saudi Arabia | 4.90 | 4.60 | 4.30 | 4.10 | 3.80 | |||||||||||||||||
| Syria | 10.8 | 10.8 | 10.9 | 10.8 | 10.8 | |||||||||||||||||
| Turkey | 6.70 | 6.30 | 6.00 | 5.80 | 5.50 |
 Helgi Library


