
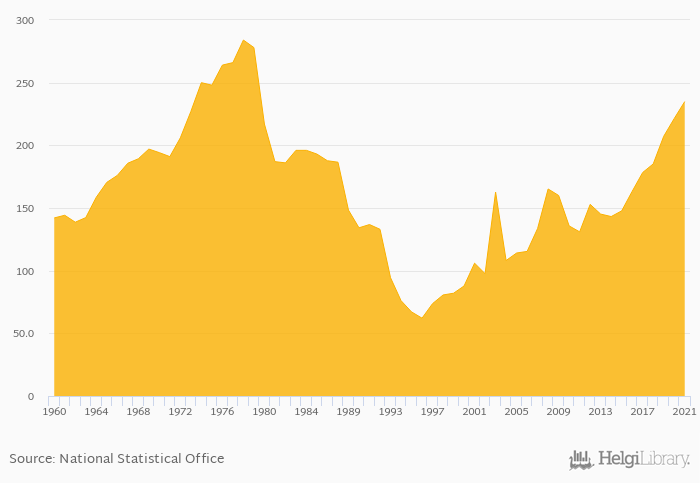
New dwellings completed rose 6.10% to 235 '000 in Poland in 2021, according to the National Statistical Office.
Historically, new dwellings completed in Poland reached an all time high of 284 '000 in 1978 and an all time low of 62.1 '000 in 1996.
Poland has been ranked 5th within the group of 28 countries we follow in terms of new dwellings completed, 9 places above the position seen 10 years ago.
| New Dwellings Completed | Unit | 2002 | 2003 | 2004 | 2005 | 2006 | 2007 | 2008 | 2009 | 2010 | 2011 | 2012 | 2013 | 2014 | 2015 | 2016 | 2017 | 2018 | 2019 | 2020 | 2021 | 2022 |
| Austria | '000 | 47.7 | 52.1 | 52.1 | 56.2 | 55.2 | ... | |||||||||||||||
| Belgium | '000 | 44.9 | 48.2 | ... | ... | ... | ... | ... | ||||||||||||||
| China | '000 | ... | ... | ... | ... | ... | ... | ... | ... | ... | ... | ... | ... | ... | ... | |||||||
| Czechia | '000 | 0.008 | 0.008 | 0.008 | 0.010 | 0.011 | ||||||||||||||||
| France | '000 | 369 | 430 | ... | ... | ... | ... | ... | ||||||||||||||
| Germany | '000 | 376 | 348 | ... | ... | ... | ... | ... | ||||||||||||||
| Hungary | '000 | 10.0 | 14.4 | 17.7 | 21.1 | 28.2 | ... | |||||||||||||||
| Japan | '000 | 967 | 965 | ... | ... | ... | ... | ... | ||||||||||||||
| Poland | '000 | 163 | 178 | 185 | 207 | 221 | ... | |||||||||||||||
| Romania | '000 | 52.2 | 53.3 | 59.7 | 67.5 | 67.8 | ... | |||||||||||||||
| Russia | '000 | 1,167 | 1,131 | 1,076 | 1,120 | 1,122 | ... | |||||||||||||||
| Slovakia | '000 | 15.7 | 16.9 | 19.1 | 20.2 | 21.5 | ... | |||||||||||||||
| USA | '000 | 1,059 | 1,153 | 1,185 | 1,255 | 1,287 | ... | |||||||||||||||
| Ukraine | '000 | 113 | 126 | ... | ... | ... | ... | ... |
 Helgi Library


