
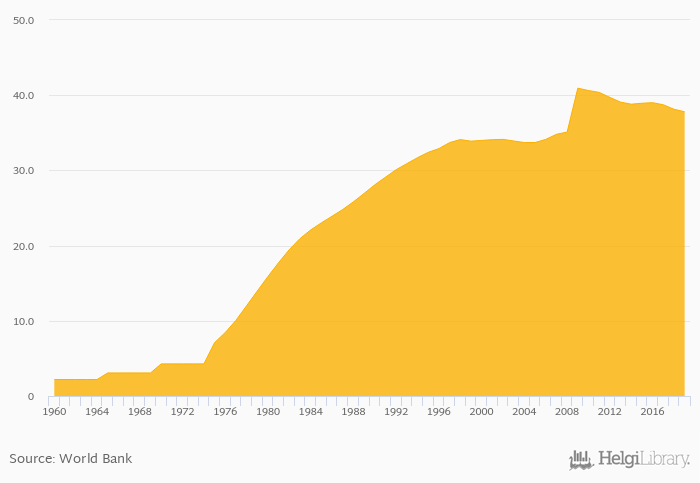
Number of fixed lines fell 0.879% to 37.8 mil in France in 2019, according to World Bank.
Historically, number of fixed lines in France reached an all time high of 40.9 mil in 2009 and an all time low of 2.19 mil in 1961. When compared to France's main peers, number of fixed lines in Belgium amounted to 3.93 mil, 40.4 mil in Germany, 19.5 mil in Italy and 19.6 mil in Spain in 2019.
France has been ranked 5th within the group of 174 countries we follow in terms of number of fixed lines, 2 places above the position seen 10 years ago.
| Number of Fixed Lines | Unit | 2001 | 2002 | 2003 | 2004 | 2005 | 2006 | 2007 | 2008 | 2009 | 2010 | 2011 | 2012 | 2013 | 2014 | 2015 | 2016 | 2017 | 2018 | 2019 | 2020 | 2021 |
| Austria | mil | 3.61 | 3.57 | 3.71 | 3.74 | 3.72 | ||||||||||||||||
| Belgium | mil | 4.49 | 4.37 | 4.28 | 4.11 | 3.93 | ||||||||||||||||
| France | mil | 38.9 | 39.0 | 38.7 | 38.1 | 37.8 | ... | |||||||||||||||
| Germany | mil | 45.4 | 45.3 | 44.4 | 42.5 | 40.4 | ||||||||||||||||
| Italy | mil | 20.2 | 20.3 | 20.7 | 20.4 | 19.5 | ||||||||||||||||
| Luxembourg | mil | 0.277 | 0.276 | 0.275 | 0.274 | 0.267 | ... | |||||||||||||||
| Morocco | mil | 2.22 | 2.07 | 2.05 | 2.20 | 2.05 | ||||||||||||||||
| Netherlands | mil | 6.95 | 6.77 | 6.55 | 5.90 | 5.56 | ||||||||||||||||
| Poland | mil | 9.05 | 8.14 | 7.41 | 6.58 | 6.04 | ||||||||||||||||
| Portugal | mil | 4.68 | 4.79 | 4.83 | 5.07 | 5.09 | ||||||||||||||||
| Slovenia | mil | 0.753 | 0.729 | 0.739 | 0.723 | 0.707 | ||||||||||||||||
| Spain | mil | 19.4 | 19.5 | 19.6 | 19.8 | 19.6 | ||||||||||||||||
| Switzerland | mil | 4.14 | 3.77 | 3.56 | 3.33 | 3.17 |
 Helgi Library


