
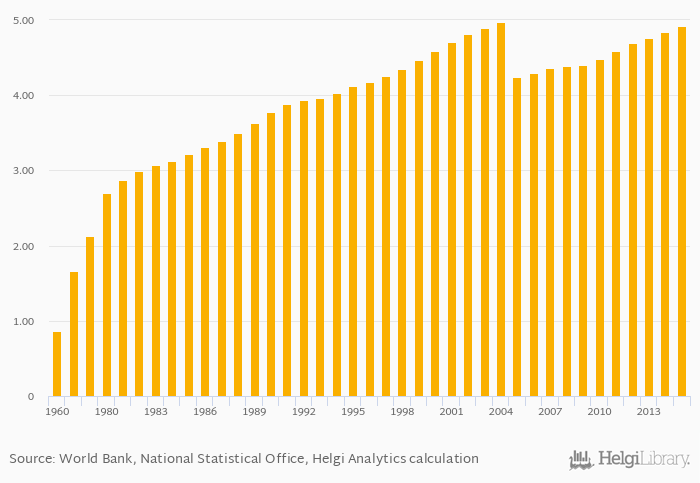
Number of motor vehicles rose 1.74% to 4.92 mil in Switzerland in 2015, according to the National Statistical Office.
Historically, number of motor vehicles in Switzerland reached an all time high of 4.97 mil in 2004 and an all time low of 0.859 mil in 1960. When compared to Switzerland's main peers, number of motor vehicles in Austria amounted to 5.20 mil, 38.7 mil in France, 48.4 mil in Germany and 42.2 mil in Italy in 2015.
Switzerland has been ranked 39th within the group of 137 countries we follow in terms of number of motor vehicles, 6 places below the position seen 10 years ago.
| Number of Motor Vehicles | Unit | 1995 | 1996 | 1997 | 1998 | 1999 | 2000 | 2001 | 2002 | 2003 | 2004 | 2005 | 2006 | 2007 | 2008 | 2009 | 2010 | 2011 | 2012 | 2013 | 2014 | 2015 |
| Austria | mil | 4.76 | 4.85 | 4.93 | 5.01 | 5.08 | ||||||||||||||||
| Belgium | mil | 5.90 | 6.04 | 6.14 | 6.18 | 6.24 | ||||||||||||||||
| France | mil | ... | ... | ... | 37.4 | 37.7 | 38.1 | 38.1 | 38.2 | |||||||||||||
| Germany | mil | 44.6 | 45.3 | 46.0 | 46.5 | 47.0 | ||||||||||||||||
| Hungary | mil | ... | ... | ... | ... | 3.48 | 3.45 | 3.44 | 3.46 | 3.52 | ||||||||||||
| Italy | mil | 41.2 | 41.7 | 42.1 | 42.0 | 41.8 | ||||||||||||||||
| Poland | mil | 19.5 | 20.5 | 21.3 | 22.2 | 22.9 | ||||||||||||||||
| Slovenia | mil | 1.16 | 1.16 | 1.17 | 1.17 | 1.16 | ||||||||||||||||
| Spain | mil | 27.4 | 27.5 | 27.6 | 27.5 | 27.2 | ||||||||||||||||
| Switzerland | mil | 4.41 | 4.48 | 4.59 | 4.69 | 4.77 |
 Helgi Library


