
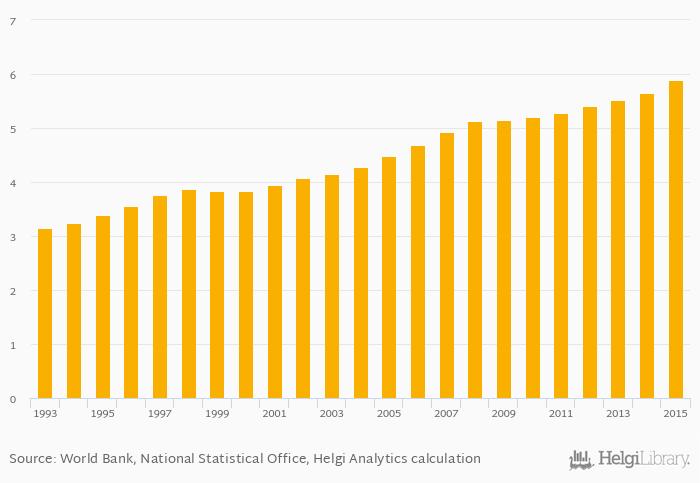
Number of motor vehicles rose 4.32% to 5.89 mil in the Czech Republic in 2015, according to the National Statistical Office.
Historically, number of motor vehicles in the Czech Republic reached an all time high of 5.89 mil in 2015 and an all time low of 3.15 mil in 1993. When compared to Czech Republic's main peers, number of motor vehicles in Austria amounted to 5.20 mil, 3.71 mil in Hungary, 24.3 mil in Poland and 2.38 mil in Slovakia in 2015.
Czech Republic has been ranked 32nd within the group of 137 countries we follow in terms of number of motor vehicles.
| Number of Motor Vehicles | Unit | 1995 | 1996 | 1997 | 1998 | 1999 | 2000 | 2001 | 2002 | 2003 | 2004 | 2005 | 2006 | 2007 | 2008 | 2009 | 2010 | 2011 | 2012 | 2013 | 2014 | 2015 |
| Austria | mil | 4.76 | 4.85 | 4.93 | 5.01 | 5.08 | ||||||||||||||||
| Czechia | mil | 5.14 | 5.20 | 5.29 | 5.41 | 5.52 | ||||||||||||||||
| Germany | mil | 44.6 | 45.3 | 46.0 | 46.5 | 47.0 | ||||||||||||||||
| Hungary | mil | ... | ... | ... | ... | 3.48 | 3.45 | 3.44 | 3.46 | 3.52 | ||||||||||||
| Italy | mil | 41.2 | 41.7 | 42.1 | 42.0 | 41.8 | ||||||||||||||||
| Poland | mil | 19.5 | 20.5 | 21.3 | 22.2 | 22.9 | ||||||||||||||||
| Russia | mil | ... | ... | ... | ... | ... | ... | ... | ... | ... | ... | 39.3 | 40.7 | 42.9 | 45.4 | 48.1 | ||||||
| Slovakia | mil | 1.89 | 1.97 | 2.06 | 2.13 | 2.20 | ||||||||||||||||
| Switzerland | mil | 4.41 | 4.48 | 4.59 | 4.69 | 4.77 | ||||||||||||||||
| Ukraine | mil | ... | ... | ... | ... | ... | ... | ... | ... | ... | ... | 7.87 | 8.13 | 8.26 | 8.91 | 9.23 |
 Helgi Library


