
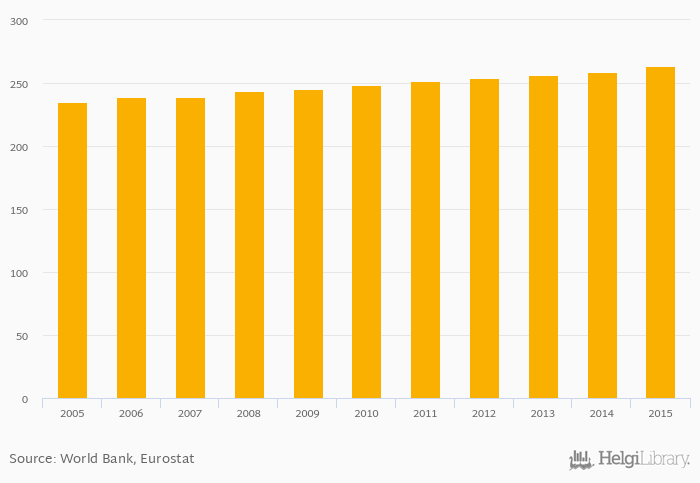
Number of passenger cars rose 1.84% to 263 mil in the European Union in 2015, according to the National Statistical Office.
Historically, number of passenger cars in the European Union reached an all time high of 263 mil in 2015 and an all time low of 235 mil in 2005. When compared to European Union's main peers, number of passenger cars in China amounted to 136 mil, 61.0 mil in Japan, 44.3 mil in Russia and 122 mil in USA in 2015.
European Union has been ranked th within the group of 137 countries we follow in terms of number of passenger cars.
| Number of Passenger Cars | Unit | 1999 | 2000 | 2001 | 2002 | 2003 | 2004 | 2005 | 2006 | 2007 | 2008 | 2009 | 2010 | 2011 | 2012 | 2013 | 2014 | 2015 | 2016 | 2017 | 2018 | 2019 |
| Canada | mil | ... | ... | 21.3 | 21.7 | 22.1 | 22.2 | 22.5 | ||||||||||||||
| China | mil | ... | ... | ... | ... | 101 | 117 | 136 | 139 | 146 | ||||||||||||
| European Union | mil | ... | ... | ... | ... | ... | ... | 256 | 259 | 263 | ... | ... | ... | ... | ||||||||
| Germany | mil | 43.9 | 44.4 | 45.1 | 44.9 | 45.0 | ||||||||||||||||
| India | mil | ... | ... | ... | ... | 18.9 | 20.4 | 22.5 | 23.0 | 23.9 | ||||||||||||
| Japan | mil | 60.0 | 60.7 | 61.0 | 61.2 | 61.4 | ||||||||||||||||
| Mexico | mil | ... | ... | ... | ... | ... | ... | 24.8 | 25.5 | 26.9 | 27.4 | 28.2 | ||||||||||
| Russia | mil | ... | ... | ... | ... | ... | 41.2 | 43.4 | 44.3 | 45.3 | 46.5 | |||||||||||
| South Korea | mil | ... | ... | ... | ... | ... | ... | 15.1 | 15.7 | 16.6 | 16.7 | 17.0 | ||||||||||
| USA | mil | 120 | 121 | 122 | 121 | 120 |
 Helgi Library


